New Category

Cadastral Mapping

Cadastral Mapping – Satpalda

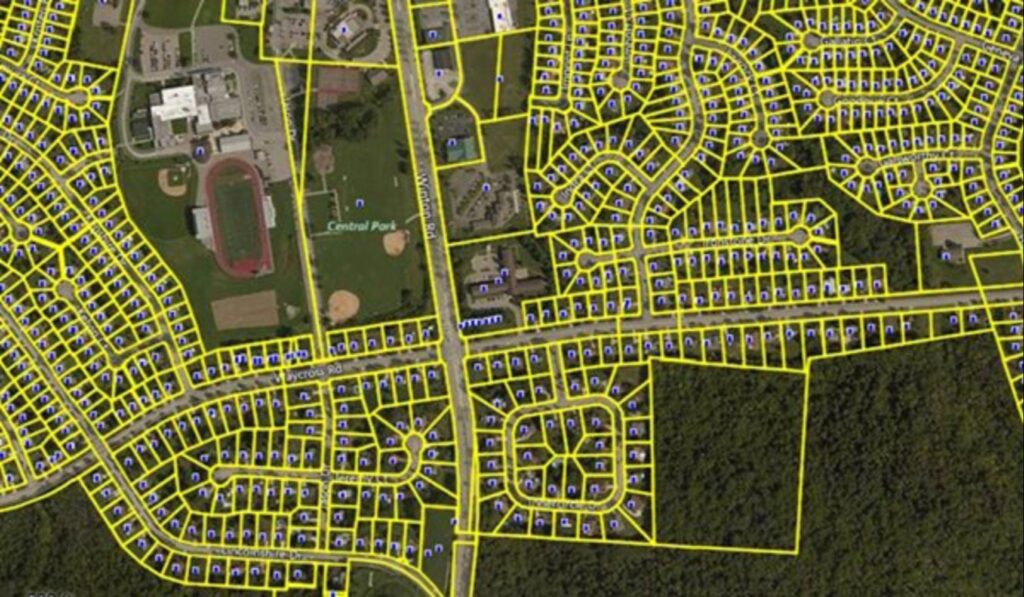
Delineating and recording land parcels, along with their boundaries, ownership details and geographical characteristics is known as cadastral mapping. Establishing a thorough and accurate record of land ownership and use is the main goal to support effective land administration, taxation, and urban planning. In Geographic Information Systems, cadastral mapping is essential because it offers a methodical and comprehensive depiction of land parcels, their borders and related data and this process delves into the complex realm of cadastral mapping examining its importance, approaches and technology as well as its wider implications for land administration and management. Important Elements: Parcel limits: Using survey information and legal descriptions, precisely defining the limits of a piece of land. Ownership Information: Specifics regarding the people who own the land such as their names, addresses and entitlements. Spatial attributes are geographic details about land parcels including their location, size and shape. Approaches for Cadastral Mapping: Cadastral Surveying Geodetic Surveys: Control points are established and precise spatial referencing is ensured by employing high-precision surveying techniques. Remote sensing: Using aerial photography and satellite data to make a preliminary assessment of land features. Gathering and Combining Data Global Positioning System (GPS): GPS stands for global positioning system and it is used to collect data in the field and provide real-time positioning. Field surveys: Measurements and data gathering were conducted on-site with the aid of Total Stations, GNSS receivers and other surveying tools. Integrating cadastral data with other geospatial information to provide a comprehensive picture is known as data integration. Technologies Geographic Information System (GIS): Database management: Database management is the process of storing cadastral data in a geographical database for quick and easy access and analysis. Spatial analysis: Spatial analysis is the process of examining spatial relationships, carrying out overlay analyses and finding patterns in cadastral data using GIS technologies. Web-Based Cadastral Systems Online Platforms: Creating web-based platforms to improve transparency and provide cadastral information to the general public. Interactive Maps: Designing approachable user interfaces to query and visualize cadastral information. Blockchain Technology Smart Contracts: Using programmable contracts and blockchain to enable safe and open real estate transactions. Immutable Recordkeeping: Preserving the durability and integrity of cadastral information while lowering the possibility of fraud. Some Case Studies Modernizing Cadastral Records in Estonia: When it comes to successfully utilizing GIS for cadastral mapping, Estonia is a shining example. This case study explores the innovative e-Land Register project in Estonia which digitized cadastral data and combined them with an intuitive GIS platform and by ensuring the security and transparency of land transactions, blockchain technology was implemented revolutionizing the cadastral system’s dependability and efficiency. Cadastral Mapping for Disaster Management in Japan: Japan is a prime example of how GIS technology may improve cadastral mapping for disaster preparedness and response where the country is prone to natural disasters. This case study investigates how Japan’s cadastral mapping system when combined with real-time data from several sensors, facilitates prompt evacuation preparation, damage assessment and recovery efforts following a disaster. The cadastral system with GIS capabilities is a helpful tool for reducing the effects of earthquakes, tsunamis and other disasters. Land Tenure Mapping in Rwanda: A thorough cadastral mapping program was a component of Rwanda’s post-genocide rehabilitation efforts. This case study looks at how GIS technology made it easier to draw boundaries between properties so that residents may have secure land tenure where the local communities were allowed to actively engage in the mapping process through the inclusion of participatory GIS approaches which promoted a sense of ownership and enhanced social and economic stability. Future Trends Blockchain Technology in Cadastral Mapping: Blockchain integration is one of the biggest themes influencing cadastral mapping in the future. Unprecedented security and transparency in real estate transactions are provided by blockchain’s decentralized, tamper-resistant ledger technology where blockchain technology can be used for cadastral mapping to improve land record trust, expedite property registration, and lower fraud. Advanced Remote Sensing Methods: The development of remote sensing technology is closely linked to the future of cadastral mapping and data acquisition for cadastral mapping is being revolutionized by hyperspectral photography, LiDAR (Light Detection and Ranging) and high-resolution satellite imagery. The precise demarcation of property boundaries and enhanced land parcel identification are made possible by these sophisticated procedures which offer more accurate and thorough spatial information. Artificial Intelligence (AI) and Machine Learning (ML) in Parcel Recognition: Significant progress is being made in automating parcel recognition in cadastral mapping by use of AI and ML algorithms and by enabling meaningful information to be extracted from large datasets, these systems lessen the amount of manual labor needed for parcel identification. Automated object detection, pattern analysis and feature extraction help to make cadastral mapping procedures more precise and quick. 3D Cadastre for Urban Planning: The use of three-dimensional (3D) cadastral mapping is revolutionizing both cadastral mapping and urban planning where the two-dimensional representation of properties in traditional cadastral maps restricts their capacity to depict the intricacy of urban settings. A more thorough picture is made possible by 3D cadastre models which also make accurate analysis easier for planning infrastructure, zoning and urban development. Cadastral mapping is essential since it lays the groundwork for efficient land management and administration and the combination of GIS, blockchain, AI and other cutting-edge technologies holds the potential to completely transform cadastral mapping as technology develops providing more precise, transparent and effective answers to the problems posed by the shifting ownership and usage of land. Governments, IT companies and the general public must work together to realize the full potential of this important field as we navigate the future of cadastral mapping.
Satellite Imagery

Satellite Imagery of the Earth

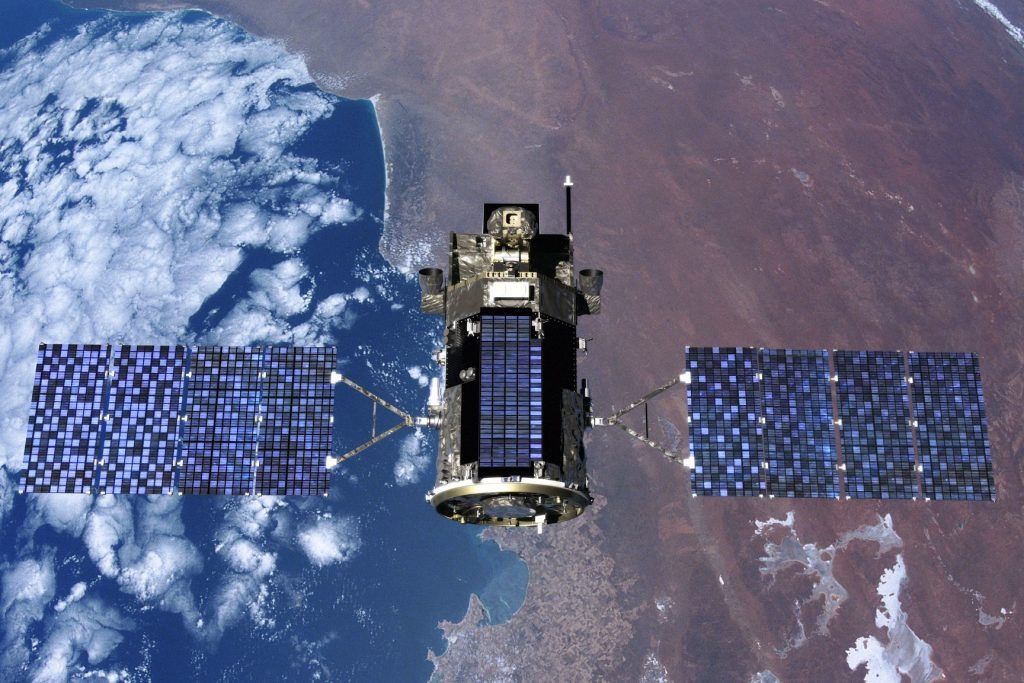
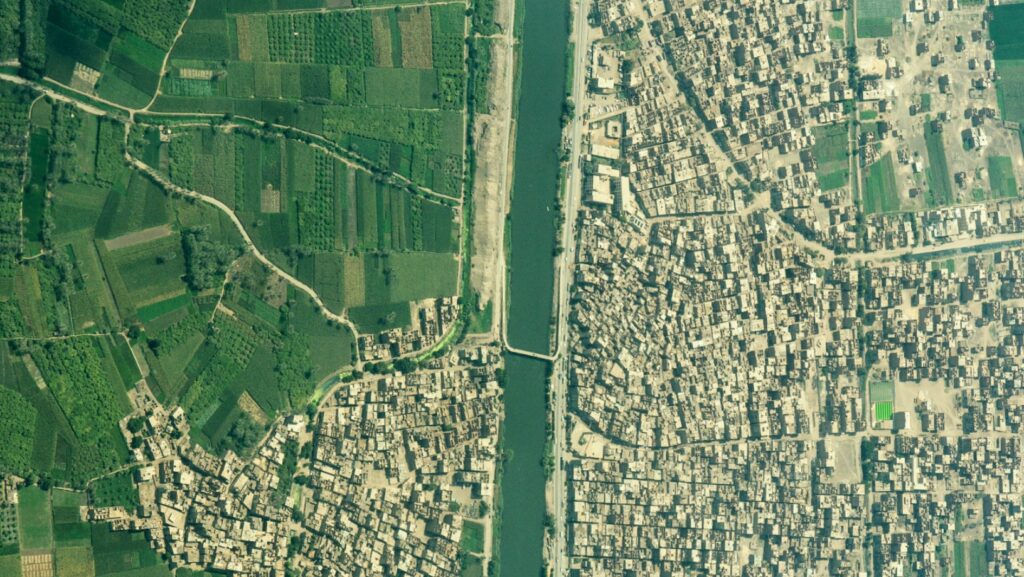
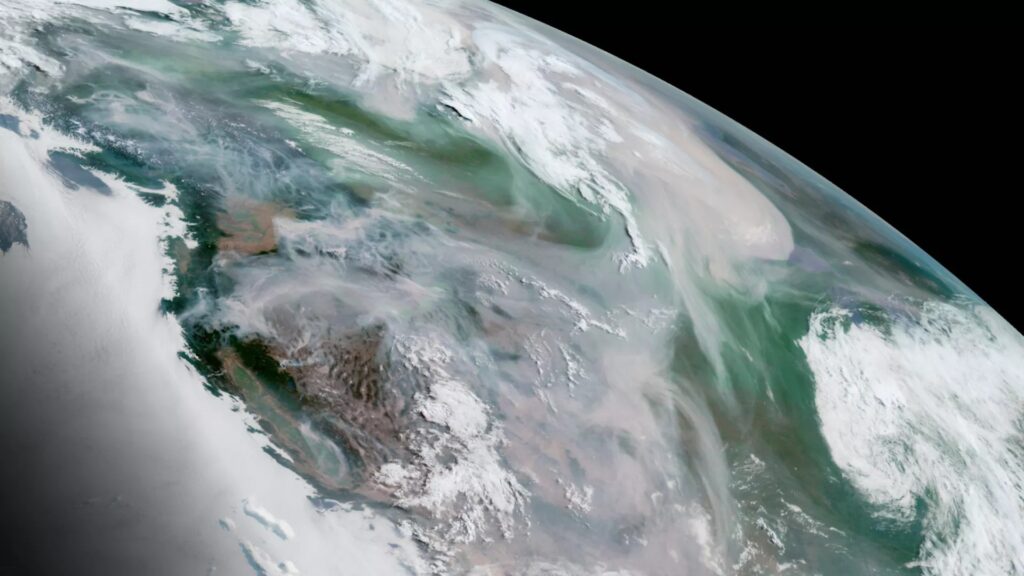
The term “satellite imagery” describes the image of the Earth’s surface that is obtained by satellites in orbit and these photos are taken with sensors that record information at different wavelengths enabling the production of hyperspectral or multispectral imaging. These photos are fundamental datasets for mapping, tracking and examining the dynamic aspects of Earth in a GIS environment. Geographic Information Systems have been transformed by satellite photography which offers unmatched insights into the Earth’s surface and permits a wide range of applications across numerous industries. This process dives into the complex world of satellite imaging examining its technological foundations, its function in geographic information systems and the various uses that make use of this potent instrument. Development of Satellite Imaging Technology The development of imaging technology on Earth-observing satellites marks the beginning of the voyage of satellite images in GIS where early spacecraft such as Landsat 1 which was launched in 1972 were able to take pictures in the visible and near-infrared spectrums. More and more complex data collecting is now possible thanks to the proliferation of sensors with different spectral bands and spatial resolutions that have been made possible by technical improvements throughout time. Resolution of Spatial Information: An image’s observable level of detail is referred to as its spatial resolution and with the ability to map and analyze details as fine as 31 cm on the Earth’s surface, high-resolution satellites like WorldView-3 make precise mapping and analysis possible. On the other hand, satellites with medium and low resolutions provide more coverage but less detail. Spectral Bands: Different spectral bands of electromagnetic radiation are detected by satellite sensors and each one yields a different set of data about the surface of the Earth. Sentinel-2’s multispectral sensors, for example, collect data in visible, near-infrared and shortwave infrared wavelengths. This allows for more sophisticated vegetation monitoring, land cover classification and environmental evaluation. Temporal Resolution: The frequency with which a satellite returns to a specific area is referred to as temporal resolution and this is essential for tracking dynamic processes like crop growth, natural disasters and changes in land usage. Polar-orbiting satellites such as Terra and Aqua’s MODIS (Moderate Resolution Imaging Spectroradiometer) offer daily worldwide coverage making near-real-time monitoring possible. Using Satellite Imageries for GIS Uses: Environmental Monitoring: Monitoring environmental changes such as deforestation, urbanization and land degradation is greatly aided by satellite imaging. GIS technologies combine satellite data with trend analysis, hotspot identification and support for sustainable resource management and Sentinel satellites of the European Space Agency, for example, provide important data for tracking deforestation in the Amazon jungle. Agriculture and Precision Farming: Precision farming makes use of satellite imagery to track crops, forecast yields and identify diseases where high-resolution photography helps with crop stress detection, irrigation optimization and general farm management enhancement. Farmers and agronomists can access and evaluate satellite data for informed decision-making using platforms like Google Earth Engine. Disaster Management: An invaluable resource for catastrophe preparedness and response is satellite imagery and satellites offer quick and thorough assessments of damaged areas following natural disasters like hurricanes, earthquakes or floods. Emergency responders can more effectively plan evacuation routes, evaluate damage and coordinate relief activities with the use of GIS tools. Development of Infrastructure and Urban Planning: GIS is essential for infrastructure development and urban planning when combined with satellite photography. Planning for future growth, evaluating infrastructure and mapping land usage are all made easier with the use of high-resolution images and GIS technology is used in smart cities to improve overall urban sustainability, monitor air quality and optimize transportation networks. Importances Earth Observation Satellites – The Technological Backbone: Earth observation satellites which are outfitted with advanced sensors that can take high-resolution pictures across the electromagnetic spectrum, are the central component of the GIS-satellite synergy and these sensors which include radar, infrared and optical systems are essential for gathering the information that underpins GIS applications. Optical sensors produce finely detailed photographs of the Earth’s surface by capturing visible and near-infrared light. These photos help with urban sprawl analysis, vegetation monitoring and land cover classification in GIS. Conversely, infrared sensors make it possible to detect even minute temperature changes which is beneficial for environmental research and agricultural evaluations whereas radar sensors are weather and daylight-independent devices that can see through clouds and give important information for mapping terrain, responding to emergencies and tracking subsidence. Environmental Monitoring and Conservation: Global environmental change monitoring and management depend heavily on satellite photography and with the use of these images, GIS applications can monitor biodiversity shifts, deforestation and land degradation. Satellites help identify ecological hotspots and measure the effects of climate change since they can collect data over wide areas at regular intervals. For example, scientists may watch the movement of wildlife, examine changes in ocean currents and keep an eye on the melting of the polar ice caps by integrating satellite data into GIS and with the help of this abundance of data, decision-makers can create conservation plans that work and tackle environmental issues using a data-driven methodology. Climate Change Research and Analysis: The intricacies of climate change necessitate ongoing observation and examination of environmental factors. Satellite imaging is a vital resource for studying climate change because it can record significant changes in the environment over time. Applications for geographic information systems use satellite data to examine trends in temperature, sea level rise, and vegetation cover and by aiding in the creation of climate models, these analyses enable scientists to forecast patterns and create plans for reducing the effects of climate change. A thorough grasp of the interconnectedness of climatic systems is made easier by the incorporation of satellite-derived climate data into GIS platforms. Satellite imagery provides a plethora of knowledge on the dynamic surface of our world and applications for satellite images are numerous and significant ranging from agricultural and urban planning to environmental monitoring and catastrophe response. The combination of satellite data and geographic information systems is expected to revolutionize our comprehension of the planet and spur advancements across numerous industries

GIS Applications in Civil Engineering

GIS Applications in Civil Engineering

Geographic Information System technology is now widely used in many different industries with significant applications in civil engineering and the spatial viewpoint provided by GIS improves the planning, design, building and maintenance of civil engineering projects. This process will examine the complex network of GIS applications in civil engineering and how they transform how we think about developing infrastructure. Understanding GIS in Civil Engineering Management of Spatial Data: The ability to handle and interpret spatial data is fundamental to GIS and spatial data in civil engineering refers to details regarding the precise location, dimensions and forms of features on Earth’s surface. With the use of GIS, engineers may combine information from multiple sources, including survey data, topographic maps and satellite imagery to create a complete picture of the project region. Site Planning and Selection: GIS helps civil engineers choose the best locations for infrastructure projects where professionals can evaluate variables including geography, resource proximity and environmental considerations by superimposing various layers of spatial data. This makes well-informed decisions easier to make early in the project planning process. Terrain Analysis: In civil engineering, topographic data is essential particularly for projects involving slope stability, drainage and grading and with the use of GIS tools, engineers may analyze the land’s aspect, slope and elevation in detail. This data is essential for making sure that structures are stable and for creating effective drainage systems. Utility Infrastructure Management: GIS is essential to the administration of sewage and water systems among other utility infrastructure. Engineers can track maintenance activities, plan for future expansions and produce detailed maps of the infrastructure that is currently in place by integrating spatial data where utility networks are more dependable and efficient overall when this proactive approach is implemented. Phases of GIS Applications in Civil Engineering Project Feasibility and Preliminary Design: GIS tools help determine a project’s viability in the early phases of a civil engineering project where engineers can analyze aspects like accessibility, environmental impact and land use. GIS aids in locating possible obstacles and improving the initial design by considering geography. Detailed Design and Engineering: GIS is still a useful tool as the project moves on to the detailed design phase and with the use of GIS, engineers may produce intricate maps and drawings that include precise spatial data. This makes it easier to precisely design infrastructure parts by accounting for the spatial interactions between various components. Construction Phase: By offering real-time geographical information, GIS systems help expedite the construction phase. Construction managers can properly manage resources, keep track of where construction equipment is located and monitor progress with the use of GIS and by doing this, mistakes and delays are reduced and the construction process is guaranteed to follow the intended design. Asset Management and Maintenance: GIS is still essential for asset management and maintenance even after a civil engineering project is finished. Engineers may more easily schedule maintenance tasks, evaluate the state of infrastructure and plan for future upgrades by using detailed spatial information to construct asset inventories. Advanced GIS Technologies in Civil Engineering Light Detection and Ranging (LiDAR): High-resolution elevation data is provided by LiDAR technology when combined with GIS. LiDAR is very helpful in civil engineering for mapping floodplains, modeling terrain and locating possible landslide regions and the exact elevation data acquired by LiDAR improves the engineering analyses’ correctness. Remote Sensing: The use of remote sensing technologies such as aerial photography and satellite imagery, greatly enhances GIS applications in civil engineering and with the use of these technologies, engineers may monitor changes in the project area, evaluate the influence on the environment and gather data for project planning and management. These technologies also give high-resolution and current geographical data. 3D Modeling: Three-dimensional modeling is now supported by advanced GIS software giving engineers a more immersive way to see projects and by offering a realistic depiction of the landscape and architecture, 3D modeling improves the design process. This enhances comprehension of the project overall and facilitates improved communication among project stakeholders. Some Case Studies Planning and Design of Highways: A significant highway extension project’s planning and design were greatly aided by GIS and it was used by engineers to optimize the alignment of the new route, study traffic patterns and evaluate the impact on the environment. This method reduced the negative effects on the surrounding ecology while simultaneously increasing the efficiency of the design process. Urban Infrastructure Development: GIS is frequently used in urban environments to build infrastructure projects like sewage and water supply networks. Engineers can create the infrastructure that minimizes environmental effects while meeting the demands of an expanding population by combining demographic data with spatial data. Disaster Response and Recovery: In the context of disaster management and recovery, geographic information systems (GIS) are incredibly useful and with the use of GIS, it is possible to quickly assess the areas affected by a natural disaster like an earthquake or hurricane. Spatial data is a useful tool for engineers to design evacuation routes, locate damaged infrastructure and efficiently coordinate rescue and recovery activities. Applications of geographic information systems have completely changed the field of civil engineering by giving professionals strong instruments for organizing, designing and overseeing infrastructure projects. GIS improves decision-making by bringing a spatial perspective to every stage of the project lifecycle from site selection to asset management. The accuracy and productivity of civil engineering procedures are further improved by the integration of GIS with cutting-edge technologies like LiDAR, remote sensing and 3D modeling and even if there are still obstacles, continued research and development in GIS technology should solve these problems and encourage even more innovation in the sector. GIS capabilities can be utilized by civil engineers to effectively navigate the spatial elements of their projects among the intricate network of infrastructure development. As time goes on, the combination of GIS and civil engineering will play a crucial role in creating a future where infrastructure is not only sustainable and functional but also closely linked to the changing spatial environment in which

KOMPSAT

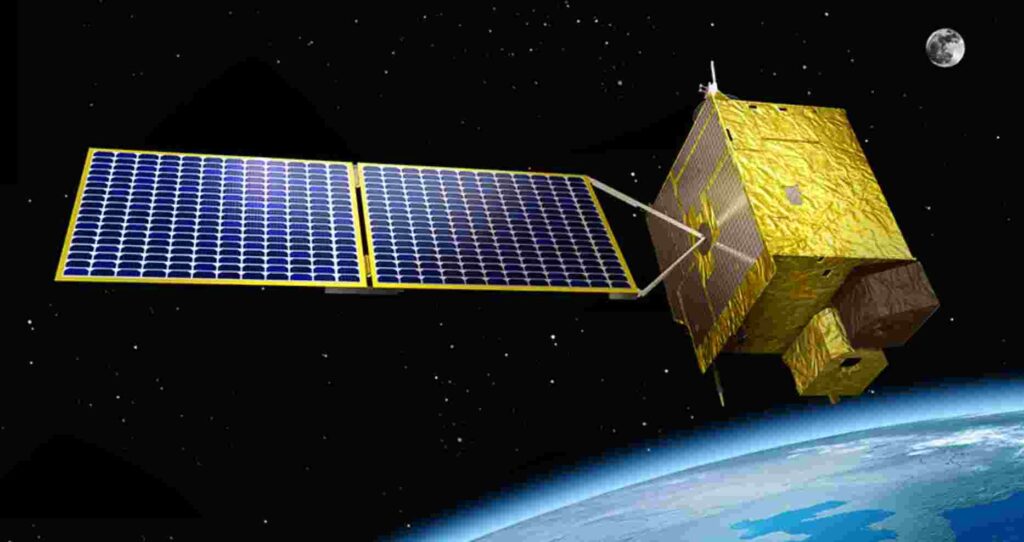
Within the dynamic field of Geographic Information Systems, satellite technology is essential for gathering, analyzing and sharing geospatial data. The Korea Multi-Purpose Satellite (KOMPSAT) series is one such technological marvel that has been creating waves in the geographic information system business and the development of remote sensing and geographical analysis has been greatly aided by the Korea Aerospace Research Institute (KARI) and its KOMPSAT satellites. We go into the technical details of KOMPSAT in this extensive piece, examining its uses, potential and influence on the GIS sector. South Korea launched the KOMPSAT program with the main goal of creating a self-sufficient satellite system for Earth observation. The program includes several satellites each intended to fulfill a particular role in Earth observation and distant sensing. South Korea entered the satellite-based Earth observation market with the launch of its first satellite, KOMPSAT-1 in 1999. KOMPSAT Satellites The KOMPSAT series comprises multiple satellites, each outfitted with sophisticated imaging sensors and instrumentation designed for particular uses and KOMPSAT-3, KOMPSAT-3A and KOMPSAT-5 are among the constellation’s more notable members as of the most recent data available. KOMPSAT-3: KOMPSAT-3 was launched in 2012 and is well known for its ability to capture optical imagery with high resolution and its multispectral camera allows it to take pictures with a spatial resolution of up to 50 centimeters which enables an in-depth examination of the surface of the planet. The satellite’s versatility and short revisit durations make it useful for a range of tasks such as monitoring disasters, agriculture and urban planning. KOMPSAT-3A: Launched in 2015, KOMPSAT-3A is yet another powerful addition to the constellation and this satellite expands on the imaging capabilities and revisits the frequency of KOMPSAT-3 building on its success. Its enhanced spectral resolution multispectral camera allows for a more precise examination of changes in flora, land cover and the surrounding environment. KOMPSAT-5: Launched in 2013, KOMPSAT-5 incorporates synthetic aperture radar (SAR) technology departing from the optical focus of its predecessors and its high spatial resolution, day and night, all-weather Earth observation is made possible by SAR. Because of this, KOMPSAT-5 is especially useful for applications where optical sensors might not be ideal, such as forestry, infrastructure evaluation and catastrophe monitoring. Technical Specifications and Capabilities Imaging Sensors: The KOMPSAT satellites’ image sensors play a crucial role in gathering the data that underpins GIS applications where multispectral cameras are crucial for optical satellites such as KOMPSAT-3 and KOMPSAT-3A. The ability of these cameras to take pictures in a variety of electromagnetic spectrum bands makes them useful tools for a range of analyses such as the classification of land cover, the tracking of vegetation and the identification of changes. The synthetic aperture radar (SAR) sensor is the focal point of KOMPSAT-5. SAR technology is a vital tool for applications requiring all-weather surveillance since it uses microwave signals to cut through clouds and darkness. The capacity to obtain SAR pictures with high resolution makes it possible to map terrain in great detail, identify ground deformation and keep an eye on natural disasters. Spatial Resolution: The degree of detail obtained in an image is referred to as spatial resolution and it is commonly expressed in terms of the size of a ground pixel. The great spatial resolution of KOMPSAT satellites is well known for enabling viewers to see minute features on the surface of the planet. For example, KOMPSAT-3 has an impressive 50-centimeter spatial resolution which allows users to precisely detect and evaluate small-scale characteristics. In GIS applications, spatial resolution plays a crucial role in determining the precision of mapping, change detection and land use classification and because KOMPSAT satellites provide high-resolution pictures, geospatial data becomes more valuable and useful for a wider range of sectors. Spectral Bands: Optical satellites such as KOMPSAT-3 and KOMPSAT-3A are outfitted with multispectral cameras that are sensitive to distinct light wavelengths. These bands help provide multispectral images which makes it easier to extract data on changes in the environment, vegetation health and land cover. For instance, because they capture the reflectance traits of healthy plants, the spectral bands in the near-infrared range are very helpful for vegetation monitoring and these bands are used by GIS specialists to calculate vegetation indices such as the Normalized Difference Vegetation Index (NDVI) which helps with ecological research, deforestation assessments and crop health evaluations. Applications of KOMPSAT in GIS Crop Monitoring and Agriculture: Accurate and timely information regarding crop health, land use and environmental factors is essential to precision agriculture. KOMPSAT satellites provide high-resolution optical images that are a substantial contribution to agricultural and crop monitoring and because of the multispectral capabilities, vegetation indices may be created which helps agronomists and farmers evaluate crop vigor, spot disease outbreaks and improve irrigation techniques. In areas where cloud cover or unfavorable weather conditions make it difficult to acquire optical imagery, KOMPSAT-5’s SAR technology is quite useful. Regardless of the weather, it makes it easier to continuously monitor agricultural regions, giving farmers access to vital data for well-informed decision-making. Environmental Monitoring and Change Detection: A key component of GIS is the tracking of environmental changes over time and KOMPSAT satellites are excellent in this area where KOMPSAT offers a comprehensive perspective of dynamic environmental conditions with its high-resolution imagery and frequent return intervals which are useful for tracking deforestation, measuring changes in land cover and monitoring natural disasters. GIS specialists can spot illicit logging operations, track the effects of climate change and detect changes in land cover because of their capacity to collect comprehensive optical imagery. Furthermore, the KOMPSAT-5’s SAR technology improves the tracking of ground deformations and aids in the evaluation of geological threats like subsidence and landslides. Future Developments Future improvements and developments to the KOMPSAT program are probably in store as technology keeps moving forward. Enhancements in spectral capabilities, data processing speed and geographical resolution are all anticipated by the GIS sector. Furthermore, automated image analysis using AI and machine learning techniques may become more common which would simplify the process of extracting valuable data from KOMPSAT photos

Railway Corridor Mapping

Railway Corridor Mapping

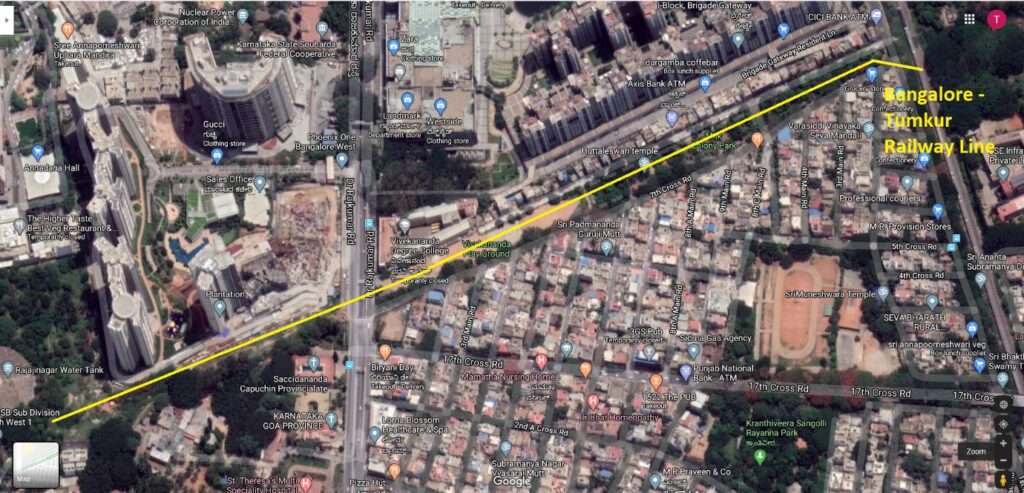
The process of producing precise and in-depth spatial representations of railroad infrastructure and its surroundings is known as “railway corridor mapping. To create detailed maps and models of railroad corridors, geospatial data must be collected, processed and analyzed. In the railway industry, these maps are an invaluable resource for planning, maintenance and operational decision-making. The mapping of railway corridors has become an essential component of the administration of contemporary transportation infrastructure. Modern Geographic Information System (GIS) technology has significantly increased productivity, safety, and overall operational excellence in the rail sector. This particular process examines the use of GIS in railway corridor mapping, going into detail about its advantages, future potential, and technical complexities. Some Fundamentals in Railway Corridor Mapping Geographic Information System (GIS) With the help of GIS, a powerful technology, one may gather, examine and display spatial data to gain a thorough grasp of spatial relationships and patterns and GIS forms the basis for data integration and analysis in the context of mapping railway corridors. Obtaining Data: The process of mapping a railway corridor begins with the collection of several statistics such as those on geography, land use and the current rail infrastructure where high-resolution spatial data collection is greatly aided by remote sensing technologies like satellite photography and LiDAR (Light Detection and Ranging). Geodatabases: Effective geographic data organization is essential. Geodatabases are used to store geographic information which makes it possible to integrate different datasets for a thorough examination of railway corridors and these databases include information about infrastructure, elevation profiles, and train alignment, among other things. Spatial Analysis Techniques GIS uses sophisticated spatial analytic methods to extract valuable information from geospatial data. When it comes to mapping railway corridors, the following methods are especially pertinent: Network Examination: The modeling and optimization of rail networks are made easier by network analysis and it comprises the identification of crucial network nodes, accessibility analysis and route optimization. This data can be used by rail operators to optimize scheduling, shorten travel times and boost system performance. Spatial Interpolation: It is essential to use spatial interpolation methods like Kriging and Inverse Distance Weighting to anticipate values in un-sampled places and it is used in railway corridor mapping to forecast the characteristics of the terrain between surveyed points which helps to create precise elevation profiles. 3D Modeling for Railway Corridor Mapping LiDAR Technology The three-dimensional mapping of railroad routes has been transformed by LiDAR technology. LiDAR sensors create extremely precise point clouds by generating laser pulses and measuring the time it takes for those pulses to return providing comprehensive data on the topography and infrastructure. Digital Elevation Models (DEMs): Elevation information is provided via DEMs generated from LiDAR data which makes it possible to create accurate 3D models of the railway line and this is crucial for evaluating the topography, spotting any obstacles and maximizing track alignment for increased safety. Building Information Modeling (BIM): The accuracy of railway corridor mapping is improved by integrating BIM and GIS since it incorporates comprehensive data on existing structures, bridges and tunnels and the integration of BIM and GIS simplifies maintenance and enables well-informed decision-making when expanding or upgrading infrastructure. Visualization Tools 3D railway corridor models must be visualized for decision-making and communication to be successful. Interactive visualization capabilities provided by GIS platforms enable stakeholders to examine the corridor from many angles, promoting improved comprehension and cooperation. Advantages Increased Security: When it comes to spotting potential safety risks along railroad routes, GIS technology is essential and it assists in identifying potential dangers by examining the topography, vegetation and infrastructure. This enables rail operators to put preventive measures in place and lower the chance of accidents. Effectiveness of Operations: Accurate corridor mapping and analysis are essential for effective railway operations where transportation efficiency for both freight and passengers is enhanced by the use of GIS, which makes real-time monitoring, predictive maintenance and efficient scheduling possible.  Assessment of Environmental Impact: GIS-based mapping of railroad corridors makes thorough environmental impact assessments possible and to minimize ecological disruptions during railway development projects, planners can make educated judgments by taking into account aspects such as geography, land usage and wildlife habitats. Future Trends in Railway Corridor Mapping LiDAR for 3D Mapping: The world of geospatial mapping has been transformed by LiDAR (Light Detection and Ranging) technology and railway corridor mapping is no exception. LiDAR sensors are capable of capturing extremely precise three-dimensional data of the railway corridor and its surroundings regardless of whether they are installed on land vehicles or aerial platforms. Precise study of the topography, elevation variations, and structural elements along the railway route is made easier by this thorough 3D mapping. This data is essential for planning infrastructure upgrades, evaluating possible risks, and creating the best rail alignments. LiDAR data integration improves the visualization and analytical capabilities of GIS platforms and offers a thorough picture of the railway corridor. Field Operations Using Augmented Reality (AR): In railway corridor mapping, augmented reality (AR) is becoming a game-changing technology for field operations. Field workers can use gadgets like smartphones or smart glasses to overlay digital information onto the physical world by utilizing GIS apps that are connected with augmented reality. Emergency response, asset maintenance, and field inspections are all improved by these capabilities. Field engineers may more effectively identify assets, monitor status, and carry out repairs by having access to real-time GIS data superimposed over their field of view. This decreases the amount of time needed for data collecting and decision-making while simultaneously increasing the accuracy of field operations. Machine Learning (ML) and Artificial Intelligence (AI) for Data Analysis: The GIS environment is changing dramatically, and artificial intelligence and machine learning are key factors in this. About railway corridor mapping, these technologies are capable of extracting significant patterns and insights from large datasets through analysis. The identification of elements including railroad assets, encroachments, and possible safety risks can be automated by AI systems. To facilitate proactive planning and resource allocation, machine learning models can also be taught to anticipate maintenance

Digital Elevation Models

Digital Elevation Models

What is a digital elevation model (DEM)? A Digital Elevation Model (DEM) is a representation of the bare ground (bare earth) topographic surface of the Earth excluding trees, buildings, and any other surface objects. GIS is based on Digital Elevation Models (DEMs) which are essential for landscape modeling, terrain analysis and other environmental applications where it gives a thorough grasp of DEMs by exploring their types, definitions, acquisition techniques and uses in the GIS sector. Digital elevation models or DEMs represent the three-dimensional distribution of terrain elevation values over a given area where the terrain data is essential for many GIS applications such as disaster management, environmental modeling and urban planning. DEMs are a key source of information for determining the important characteristics of the terrain which enables analysts to visualize and analyze landscape elements precisely. Types of DEM Airborne LiDAR DEMs: Using laser pulses, LiDAR (Light Detection and Ranging) technology measures distances and produces extremely precise elevation models and by installing LiDAR sensors on airplanes, it is possible to create airborne LiDAR DEMs that enable quick and accurate data collecting. Because of their great spatial resolution, the resultant DEMs are perfect for use in infrastructure development, flood modeling and forestry management. Satellite-based DEMs: Remote sensing technology is used by satellite-derived DEMs to obtain elevation data from space where the global-scale DEMs are partly produced by platforms such as the Advanced Spaceborne Thermal Emission and Reflection Radiometer (ASTER) and the Shuttle Radar Topography Mission (SRTM). Although DEMs derived from satellites provide a large coverage area, their spatial resolution could be inferior to that of LiDAR-based models. Applications for these DEMs include large-scale environmental monitoring, land cover analysis and regional planning. Structure from Motion (SfM) DEMs: A photogrammetric method called Structure from Motion reconstructs 3D structures from sequences of 2D images and when used in DEM creation, SfM merges overlapping photos captured from various angles to produce precise and intricate terrain models. This method works well for applications such as precision agriculture, landslide analysis and archeological site monitoring as it is affordable and can be used with consumer-grade cameras. Interferometric Synthetic Aperture Radar (InSAR) DEMs: With the use of radar signals from satellites, InSAR technology measures changes in ground surface elevation with remarkable accuracy and to track subsidence, uplift and other deformations over time. In SAR, DEMs can be created by examining the patterns of radar wave interference. Urban subsidence monitoring, tectonic plate movement and geohazard evaluations all benefit greatly from this kind of DEM. Terrain Models with Varying Resolutions: Another way to classify DEMs is by their spatial resolution and while low-resolution models cover greater regions but with less detail, high-resolution digital elevation models (DEMs) capture finer aspects of the landscape but may cover smaller areas. In applications like urban planning, environmental impact assessment and natural resource management, this classification is essential for striking a balance between coverage and detail. Orthorectified DEMs: The technique of orthorectification involves taking out distortions from aerial or satellite pictures that are brought about by sensor geometry and terrain relief. Georeferenced and devoid of geometric errors, orthorectified digital elevation models (DEMs) offer a precise depiction of the Earth’s surface and in applications where precise geographic data is essential such as infrastructure planning, precision agriculture and cartography, these DEMs are commonly employed. Methods for Acquiring DEMs: Airborne LiDAR: High-precision elevation data is produced by using reflected laser pulses emitted by LiDAR sensors installed on airplanes to the ground and high-resolution DEM creation and large-scale mapping are made possible by the effectiveness of airborne LiDAR. Satellite-based DEMs: Elevation data is gathered globally by satellite sensors such as those on board the Shuttle Radar Topography Mission (SRTM) and WorldView satellites. These datasets aid in the creation of DEMs with medium to coarse resolution that are appropriate for regional and international applications. Photogrammetry: To extract elevation information, photogrammetry entails interpreting stereo pairs of aerial or satellite photos and this technique is popular and economical for mapping a variety of terrains. Important Technical Words: Z-Values: The elevation values that are allocated to each point in a DEM are represented by Z-values where comprehending Z-values is essential for precise analysis and description of terrain. Interpolation: To estimate elevation values between known data points, interpolation techniques like kriging and inverse distance weighting are used. These techniques improve DEMs’ spatial resolution. Spatial Resolution: In a DEM grid, the size of individual cells or data points is referred to as spatial resolution. More comprehensive topographical information can be obtained with higher spatial resolution, although this may necessitate more processing and storage power. Aspect: An aspect is a terrain surface’s orientation and it is an essential parameter for comprehending the properties of the slope and the distribution of solar radiation. Slope: Slope expresses how steep the surface of the land is and slope analysis is necessary for applications such as hydrological modeling and land suitability assessment. Hillshade: This method mimics the shading effects of sunlight to help visualize topographical features and it improves DEMs’ three-dimensional vision. DEMs applications in GIS: Hydrological Modeling: The creation of stream networks, the determination of watershed borders and flow direction are all made possible with the help of DEMs. Terrain Analysis: GIS experts classify landforms, map land cover and conduct geological research using DEMs for terrain analysis. Viewshed Analysis: This technique helps choose sites for a variety of uses including surveillance systems and telecommunications towers, by using digital elevation models (DEMs) to identify observable areas from particular locations. 3D Visualization: By facilitating the production of lifelike 3D representations, DEMs improve the understanding of spatial data and aid in the process of making decisions. Natural Resource Management: By offering information on elevation differences, assisting with forest management, predicting soil erosion and promoting biodiversity conservation, DEMs support the management of natural resources. Digital elevation models are invaluable resources in the GIS field since they offer a precise depiction of the surface of the planet and with a wide range of forms and techniques of acquisition, DEMs enable GIS specialists to perform accurate

Ground Penetrating Radar (GPR)

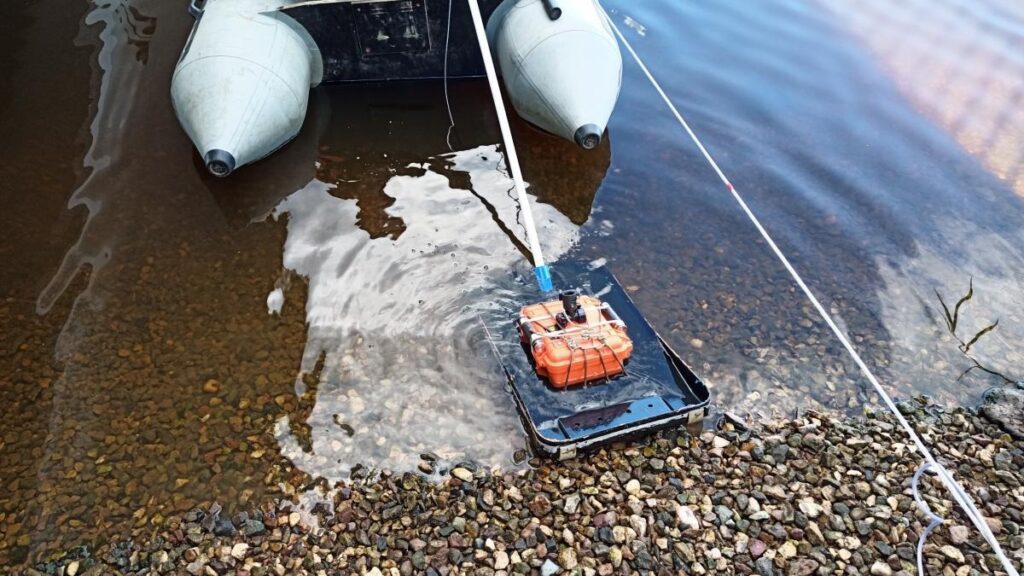
Technological developments in the field of Geographic Information Systems (GIS) are always pushing the frontiers of investigation and analysis. Ground Penetrating Radar (GPR) is one such innovative technology. By looking beneath the surface of the Earth, this state-of-the-art technology provides a unique perspective that goes beyond typical GIS tools. We will examine the principles, uses, and revolutionary effects of ground-penetrating radar on the GIS sector in this essay as we delve into the complexities of this technology. The electromagnetic wave propagation theory underpins the operation of ground-penetrating radar. It records the reflections that bounce back from high-frequency radio wave pulses that are sent into the ground. A transmitter-receiver antenna, a control device, and data processing software make up the system. Different subsurface materials allow different electromagnetic waves to pass through them; these changes in electrical characteristics cause reflections. After processing, a thorough cross-sectional image of the underlying strata is produced from these reflections. Technical Components System of Antennas: The antenna, which transmits and receives electromagnetic waves, is the central component of any GPR system. Different frequencies are available for different penetration depths and resolutions of GPR antennas. While high-frequency antennas offer finer detail but have a restricted depth range, low-frequency antennas can reach deeper into the subsurface at the expense of resolution. Dual-frequency systems, which provide a balance between resolution and depth, are also widely used. Units for Transmitter and Receiver: Short bursts of electromagnetic pulses, usually in the microwave or radio frequency range, are produced by the transmitter unit. The subsoil receives these pulses after they have passed through the antenna. In contrast, the reflected signals from the subsurface features are picked up by the receiver unit. The depth and location of the subsurface anomaly are determined by measuring the time it takes for the signal to return. Accurate data interpretation depends on the transmitter and receiver being precisely synchronized. Data processing and the control unit: The control unit, which oversees the radar’s timing, triggering, and general operation, acts as the GPR system’s brain. An interface for adjusting system settings, like antenna frequency and pulse length, is frequently included. The raw signals are processed to reduce noise, improve signal-to-noise ratio, and transform temporal data into spatial information after data capture. The conversion of unprocessed GPR data into useful subsurface maps depends heavily on sophisticated signal processing techniques, which are frequently combined with GIS software. Systems for Georeferencing and Positioning: Accurate georeferencing is essential for GIS applications. To precisely determine the position and orientation of the radar during data collection, GPR systems incorporate GPS (Global Positioning System) and IMU (Inertial Measurement Unit) technology. The production of subsurface maps with precise spatial coordinates is made possible by this geospatial data. Analysis and interpretation are made simple by the integration of GPR data with already existing GIS databases. Power Supply and Mobility: GPR systems require strong power supplies and mobility features because they frequently operate in a variety of difficult settings. Rechargeable battery-powered portable solutions give geospatial experts freedom in the field and enable them to effectively cover wide areas. It’s crucial to strike a balance between power usage and operating time, particularly in isolated areas where charging might not always be possible. Display and Visualization: Visualizing GPR data is an essential part of the GIS process. Sophisticated display systems provide real-time subsurface feature visualization; they are frequently connected with GIS software. With the aid of these displays, people may instantly evaluate data and make decisions. Tools for three-dimensional visualization improve our comprehension of underlying structures and make it easier to spot environmental abnormalities, utility lines, and relics from archaeology. Integration and Storage of Data: Large volumes of data are produced by GPR systems, necessitating effective storage options. High-capacity storage devices and wireless data transfer to centralized databases are features of modern GPR systems. GPR data may be seamlessly integrated with GIS databases, enabling users to overlay it with additional layers of geospatial information. The total comprehension of subsurface elements within the larger geographic context is improved by this integrated approach. Quality Assurance and Calibration: The system incorporates quality control and calibration procedures to guarantee the precision and dependability of GPR data. System parameters are adjusted during calibration operations to take environmental variables, such as differences in soil composition and moisture content, into consideration. The purpose of quality control checks is to find and fix irregularities in the collected data so that the output is as accurate as intended. Ground Penetrating Radar  Applications in GIS Uses for GIS Archaeology and Cultural Heritage: Ground Penetrating Radar has transformed archaeological surveys by allowing researchers to find artifacts and hidden buildings without the need for excavation. With the use of technology, historical sites may be examined without causing damage, protecting cultural heritage and offering insightful information about the past. Infrastructure and Civil Engineering: Within the field of civil engineering, GPR is essential for evaluating the state of infrastructure. It enables preventive maintenance and averts possible tragedies by detecting voids, subsurface anomalies, and deterioration in concrete structures. Environmental Studies: GPR is a tool used by environmental scientists to investigate groundwater levels, pollution, and soil composition. Researchers can better understand environmental dynamics and support resource management and conservation efforts by mapping subsurface conditions. Utility Mapping: GPR is used in urban planning for utility mapping and management. It lowers the possibility of unintentional harm during building and excavation projects by assisting in the identification of subterranean utilities like pipes and wires. Geophysical Investigation: GPR is used in the oil and gas sector for geophysical exploration. It can help with effective resource extraction by identifying possible reservoirs, defining subsurface structures, and evaluating geological formations. Technological Developments in Ground Penetrating Radar Multiple Frequency Systems: The creation of multi-frequency systems is one recent development in GPR technology. These devices can change frequencies while collecting data, enabling a more thorough subsurface investigation. This adaptability is very useful while researching various geological formations. Connectivity to Geographic Information Systems: Integration with GIS systems has emerged as a key strategy to improve the synergy

Encroachment Detection

Encroachment Detection

Within the field of Geographic Information Systems (GIS), encroachment management and detection have emerged as critical responsibilities for land administration, infrastructure development, and urban planning. Maintaining accurate geographical data and ensuring the effective use of land resources are significantly hampered by encroachment, which is commonly described as unauthorized entry onto another’s property. The complexities of encroachment identification in the GIS sector are examined in this article, along with the technical approaches and state-of-the-art instruments used to locate, evaluate, and lessen encroachment. Recognizing the Importance of Encroachment In a GIS setting, encroachment is the term used to describe the unpermitted use or occupation of a land area, parcel, or property. This phenomenon can take many different forms, including trespassing, unlawful building, and the extension of construction outside of approved borders. It is imperative to detect and remove encroachments for multiple reasons: Property Rights and Land Management: Establishing and defending land ownership rights depends on precise property boundary delineation. Encroachments require accurate detection and documentation because they might cause disagreements and legal complications. Urban Planning: Encroachments can upset the balance of spatial arrangements and obstruct planned development in urban settings. The integrity of urban planning projects is contingent upon the adherence of structures to zoning restrictions. Infrastructure Development: Projects involving utilities, transportation, and communication may be hampered by encroachments on approved infrastructure corridors. Encroachment detection and remediation are essential phases in guaranteeing the successful implementation of infrastructure projects. Technical Underpinnings High-Resolution Satellite Imagery: High-resolution satellite imagery is one of the main instruments used to detect GIS encroachment. Contemporary satellite sensors offer fine-grained perspectives of topography, making it possible to discern alterations in land utilization and uncover unapproved constructions. Object-based image analysis (OBIA) and other automated image processing methods are essential for deriving valuable information from satellite data. LiDAR Technology: Laser light is used in Light Detection and Ranging (LiDAR), a remote sensing technology, to detect distances. When combined with GIS, LiDAR data makes accurate three-dimensional landscape mapping possible. When it comes to spotting encroachments in regions with intricate topography and detecting minute variations in elevation, this technology is invaluable. AI Algorithms and Machine Learning: The combination of AI and machine learning algorithms has transformed the field of incursion detection. The automatic detection of encroachments is made possible by the ability of these algorithms to be trained to identify patterns and abnormalities in spatial data. Support vector machines (SVM) and convolutional neural networks (CNN) are two examples of classification algorithms that have demonstrated impressive effectiveness in this area. Geospatial Data Analysis: This type of data analysis looks at different data sets, such as cadastral, zoning, and land parcel information. GIS experts can spot irregularities and encroachments by overlaying these layers and carrying out geographical studies. For example, buffer analysis aids in determining how close structures are to property lines. Global Navigation Satellite Systems (GNSS): GPS and other GNSS technologies offer precise location data that is necessary for verifying spatial information. Real-time monitoring and mapping made possible by GNSS and GIS integration facilitate the on-the-ground confirmation of encroachments detected by remote sensing technology. Techniques for Detecting Intruders Change Detection Analysis: To find changes throughout time, change detection compares various sets of geographic data. GIS experts can identify possible encroachments by identifying changes in land use or unpermitted buildings by examining historical satellite imagery or LiDAR data. Cadastral Audits: To find discrepancies, cadastral maps and documents are systematically reviewed as part of cadastral audits. These audits, which are frequently enhanced by field surveys, assist in confirming property borders and locating encroachments that might not be visible from remote sensing alone. Mobile GIS Applications: By using mobile GIS applications, field data collection is made easier. When conducting on-site inspections, GIS specialists with mobile devices can update spatial data in real-time and record encroachments. The timeliness and accuracy of the encroachment data are improved by this method. Crowdsourced Data: Using crowdsourced data to identify intrusions may be useful in some circumstances. With specialized apps, citizens with smartphones may report such encroachments, giving GIS experts important information for additional investigation. Case Studies in GIS Encroachment Detection City Planning in Singapore: GIS technology is used by Singapore, a city-state renowned for its careful urban planning, to track land use and spot encroachments. The government makes use of LiDAR data and high-resolution satellite images to make sure that developments follow zoning laws, which helps to maintain the city-state’s orderly urban landscape. Land Administration in Rwanda: To protect property rights and stop encroachments, Rwanda has successfully put in place GIS-based land administration systems. Rwanda has greatly decreased land-related conflicts and unpermitted land use through cadastral audits, satellite photography, and community involvement. Future Trends in GIS Several trends are influencing how incursion detection will develop in the future as GIS technology advances: Integration of IoT Sensors: Real-time data on land use and environmental conditions can be obtained from Internet of Things (IoT) sensors. The dynamic monitoring of encroachments and improved response of detection systems are made possible by the integration of IoT data with GIS. Blockchain for Land Records: Research is being done on using blockchain technology to manage land records transparently and safely. Blockchain can improve the integrity of GIS data by offering a decentralized, immutable ledger, which lowers the possibility of unwanted changes. Advanced AI and Deep Learning: As AI and deep learning algorithms continue to progress, the accuracy of incursion detection will be further improved. With the use of these technologies, GIS systems will be able to automatically pick up on and adjust to changing land use trends. In the GIS sector, encroachment identification is a complex task that calls for a combination of state-of-the-art technologies, reliable procedures, and a thorough comprehension of ethical and legal issues. Global landscapes are being continuously altered by urbanization and infrastructure development, making GIS an indispensable tool for managing and protecting land resources. GIS specialists may make a substantial contribution to the equitable and sustainable use of land by adopting new ideas and staying up to date with technology improvements. This will

Geospatial Technology used for Digital Twin

Geospatial technology has become a potent tool in the quickly changing technological landscape, revolutionizing our understanding of and interactions with our surroundings. The development and use of digital twins is one of the most fascinating uses of geospatial technology. With an emphasis on essential components like 3D building models, 3D city models, Digital Elevation Models (DEMs), and GIS mapping, this article examines the critical role that geospatial technology plays in creating digital twins. A variety of instruments and methods for gathering, processing, and visualizing spatial data are included in geospatial technology. This technology gathers and interprets geographic data using a variety of sensors, GPS units, and satellite imagery. A key element of geospatial technology is the GIS (Geographic Information System), which provides the digital framework for mapping and analyzing spatial data. What is a digital twin? Digital Twins: An Overview of Concepts – A digital twin is an electronic copy of a real-world item, procedure, or system. It is a dynamic replica that mimics real-world objects in real-time rather than just a static model. The notion of digital twins has become increasingly popular in a number of industries, such as manufacturing, infrastructure management, and urban planning. Our capacity to model and comprehend the real world is changing as a result of the collaboration between digital twins and geospatial technology. Here are some ways that geospatial technology is essential to the development and improvement of digital twins: 3D Building Models: The Foundation of Architecture A complex three-dimensional building model is the core component of many digital twins. Buildings can be accurately and in great detail represented in three dimensions thanks to geospatial technology. LiDAR (Light Detection and Ranging) technology, sophisticated mapping methods, and high-resolution satellite imagery are all used in this. A digital twin’s architectural framework is a 3D building model, which offers a realistic and engrossing experience. For urban planners, architects, and decision-makers to visualize and simulate scenarios ranging from urban development to disaster response, this level of detail is essential. 3D City Models: Getting Around in Urban Environments Comprehensive 3D city models are made possible by geospatial technology, which broadens the focus beyond individual buildings. These models incorporate information about infrastructure, buildings, and natural features to capture entire urban landscapes. The end product is a comprehensive representation that makes it easier to manage infrastructure, improve public services, and plan urban areas. Through the incorporation of 3D city models into digital twins, stakeholders can examine how different factors affect the urban environment. This entails determining the efficacy of suggested modifications, comprehending traffic patterns, and allocating resources for utilities and emergency services as efficiently as possible. Terrain Dynamics: Capturing Digital Elevation Models (DEMs) A vital part of geospatial technology that records the elevations of the Earth’s surface are digital elevation models. DEMs depict an area’s topography, including hills, valleys, and topographical changes, using elevation data. Particularly in situations like environmental monitoring, agriculture, and disaster management, this information is crucial for producing accurate and realistic digital twins. DEMs aid in the accurate depiction of the physical world in the context of digital twins. For example, they are essential in modeling the movement of water across a terrain, forecasting the occurrence of floods, or comprehending the effects of topographical modifications on urban growth. GIS Mapping: Connecting the Pieces The foundation of geospatial technology is GIS mapping, which is also essential for creating and improving digital twins. Geographic Information Systems (GIS) facilitate the amalgamation and evaluation of heterogeneous spatial datasets, furnishing an all-encompassing perspective of the environmental and physical attributes of an area. GIS mapping facilitates a more nuanced understanding of the relationships between various elements in a digital twin by making connections between disparate data layers. This covers the interactions between structures, natural features, infrastructure, and socioeconomic variables. GIS mapping gives complex scenarios a spatial context, which helps with data-driven decision-making. Utilizations in All Sectors: The integration of digital twins and geospatial technology has broad implications for a variety of industries: Urban Development and Planning: With the use of geospatial technology, comprehensive 3D city models can be produced, giving urban planners the ability to examine and assess suggested changes to the urban environment. With the use of digital twins, different urban development scenarios can be simulated, assisting decision-makers in evaluating the effects on the environment, traffic, and infrastructure. Infrastructure Supervision: By offering a thorough grasp of the built environment, 3D city and building models facilitate effective infrastructure management. Digital twins help with predictive maintenance of infrastructure, which lowers downtime and improves overall performance. Disaster Management: Natural disasters like floods, earthquakes, and wildfires can be predicted and simulated with the help of digital twins that integrate digital elevation models. In times of disaster, geospatial technology’s real-time data facilitates quicker reactions and wiser decisions. Environmental Surveillance: Monitoring changes in the natural environment, such as deforestation, land degradation, and climate change, is made easier with the use of geospatial technology, including DEMs. Digital twins offer an all-encompassing perspective of the surroundings, supporting conservation initiatives and sustainable resource management. Challenges and Upcoming Trends Although there is a lot of promise for integrating digital twins and geospatial technology, there are some issues that must be resolved: Interoperability and Data Integration: It’s still difficult to ensure the smooth integration of various datasets from various sources. Setting up data interoperability standards is essential to building accurate and thorough digital twins. Security and Privacy Issues: Since digital twins incorporate real-time data from multiple sources, privacy and security issues must be properly addressed to avoid misuse and unauthorized access. Scalability: The ability of digital twins to expand to encompass larger regions or intricate systems necessitates constant improvements in processing speed and computing power. User Instruction and Acceptance: The intricacy of digital twin concepts and geospatial technology may make user adoption and education difficult. One key component in the creation and advancement of digital twins has been the emergence of geospatial technology. Every element, from GIS mapping and DEMs to 3D building models, is essential to producing realistic, dynamic, and priceless virtual

What are the applications of LiDAR in GIS?

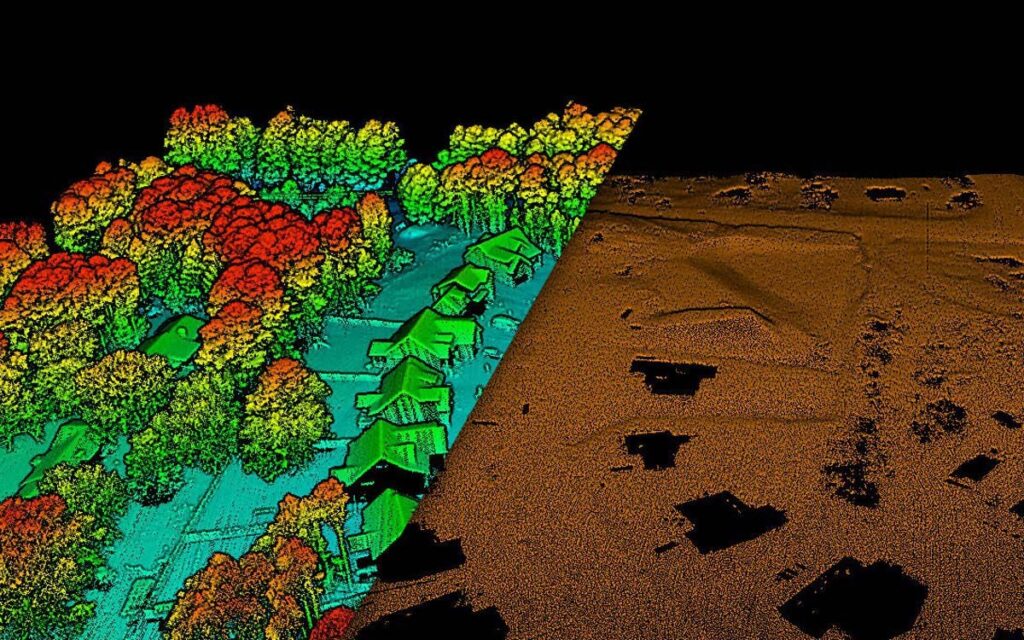
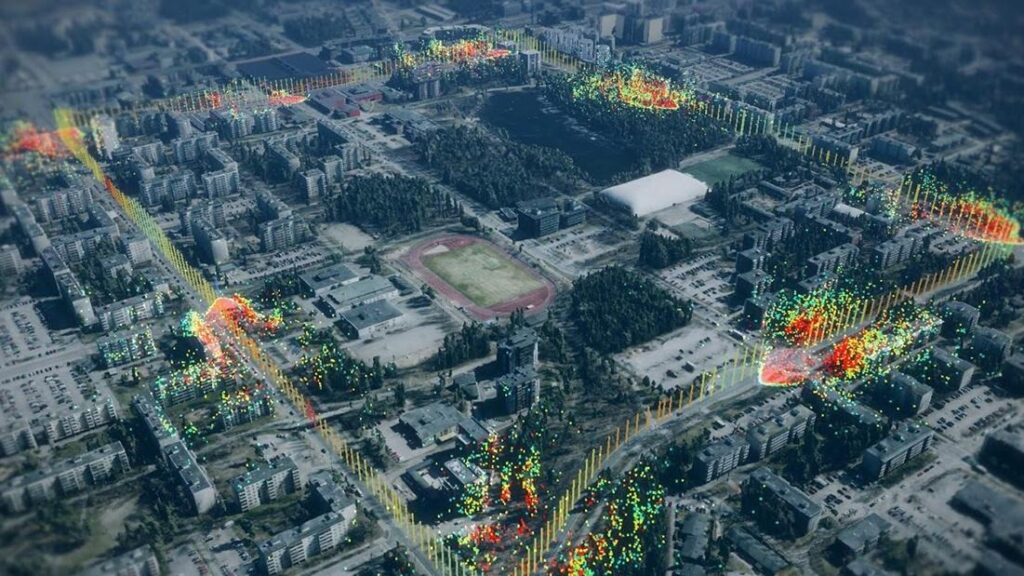
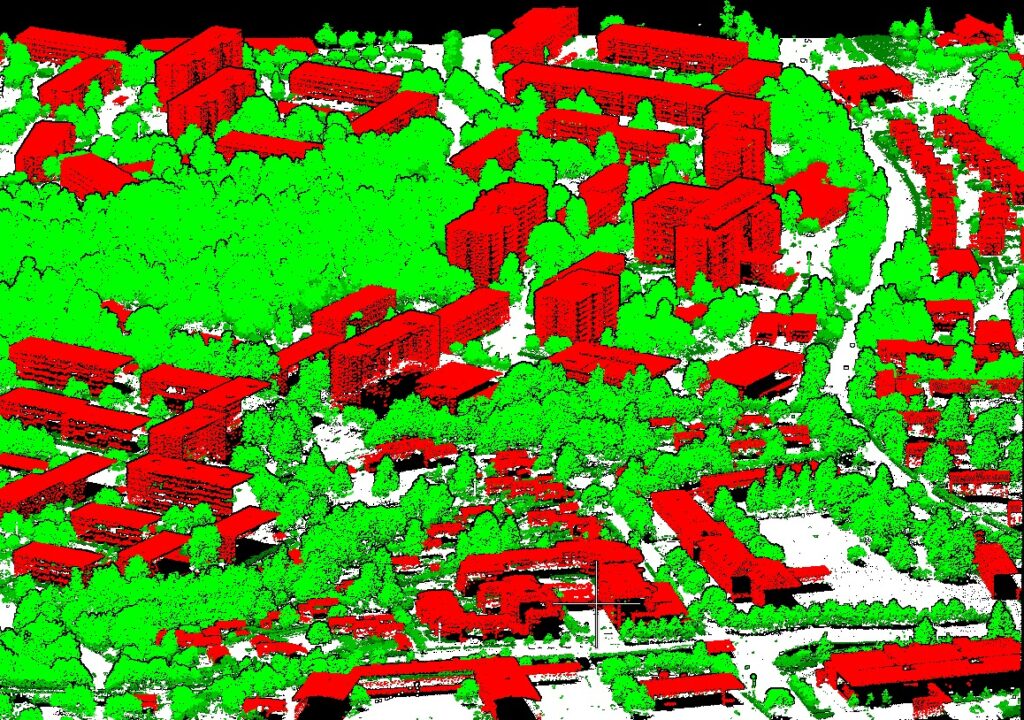
What is LiDAR in GIS? GIS has seen a revolution in technology with the emergence of LiDAR, or Light Detection and Ranging. LiDAR, which uses laser light to measure distances extremely accurately, is becoming a vital technique for gathering extremely comprehensive geospatial data. This article examines the complexities of LiDAR technology, the subtleties of LiDAR data, and the complex procedures used by the GIS sector to process LiDAR data. Using laser beams to estimate the distance between the sensor and the target surface, LiDAR works on the active remote sensing principle. The LiDAR sensor, mounted on an aircraft or ground-based platform, releases laser pulses reflected off objects and then back to the sensor, allowing for accurate distance readings. The basis of LiDAR data is the resultant point cloud, which is made up of millions of 3D coordinates. LiDAR data usually consists of the following essential elements:   Point Clouds: Point clouds are the basic units of LiDAR data; they are made up of discrete points in three dimensions, each of which represents a distinct place on the surface of the planet. Intensity Values: By encapsulating the reflected laser energy, the intensity values linked to every point in the cloud improve the LiDAR data’s interpretability. Return Types: LiDAR pulses can have a variety of returns, each of which can provide details on the surface properties. First returns (top of the canopy or terrain), last returns (bottom of the canopy or terrain), and intermediate returns are common return types. Information about Georeferencing: A LiDAR dataset’s points are all georeferenced, enabling precise spatial location inside the Earth’s coordinate system. LiDAR applications for GIS Professionals’ ability to analyze and depict geographic data has been revolutionized by LiDAR technology thanks to its adaptability, which has accelerated its incorporation into a variety of GIS applications. Among the important applications are: Terrain Modeling: Because of LiDAR’s extreme precision, precise digital elevation models (DEMs) and terrain models may be produced. This is important for applications like landform characterization, slope analysis, and mapping floodplains. Forestry and Vegetation Analysis: LiDAR is useful for determining biomass, analyzing vegetation structure, and evaluating the health of forests. It makes it possible to analyze canopy height, density, and structure in great detail. Urban Planning and Infrastructure Management: LiDAR provides comprehensive data on buildings, roads, and other infrastructure components, which helps in urban planning. It is useful for managing utility networks, keeping an eye on urban growth, and evaluating land usage. Floodplain Mapping and Hydrology: River channel mapping, floodplain delineation, and hydrological process modeling are all made easier with the use of LiDAR. Precise flood risk assessment is facilitated by precise elevation data obtained from LiDAR. GIS-Based LiDAR Data Processing In its unprocessed state, LiDAR data is a vast array of points from which valuable information must be extracted. The standard method for processing LiDAR data is outlined in the following steps: Obtaining and Preparing Data: a. Flight Planning: Careful flight planning is necessary to provide optimal coverage and high-quality data before data collection. b. Sensor Calibration: Accurate distance readings are ensured by calibrating the LiDAR sensor to take into account variations in the angle of the laser beam. Classification of Point Clouds: a. Ground Filtering: It’s important to separate ground points from non-ground points. Progressive morphological filters are one type of algorithm that aids in precisely identifying terrain surfaces. b. Vegetation Classification: Applications in forestry are aided by the classification of sites as vegetation or non-vegetation. LiDAR data makes it possible to analyze canopy density and structure in great detail. Integration of Data: a. Combining LiDAR with Other Data Sources: LiDAR data becomes more useful when it is integrated with other geospatial information. For instance, merging satellite photos and LiDAR data offers a thorough perspective of the terrain. Feature Deletion: a. Building Extraction: LiDAR data may be automatically processed by algorithms to detect and extract building footprints, which makes infrastructure management and urban planning easier. b. Road and Transportation Network Extraction: Road networks may be located and mapped using LiDAR data, which helps with transportation management and planning. Information Visualization: a. Immersion visualization is made possible by the intrinsic 3D nature of LiDAR data. The capacity of GIS specialists to produce intricate 3D representations of landscapes improves the interpretability of geographical data. b. Orthophoto Generation: Accurate orthophotos are produced by combining LiDAR data with high-resolution photography, which enhances the way the terrain is depicted visually. Validation and Quality Control: a. Accuracy Assessment: Strict quality control procedures, such as statistical validation and ground truthing, guarantee the accuracy of processed LiDAR data. b. Error Correction: Ensuring data integrity requires the identification and correction of flaws in LiDAR data, such as misclassifications or outliers. Upcoming Patterns Progress in Sensing Technology: a. Miniaturization: As LiDAR sensors get smaller and lighter, more platforms—such as drones and small satellites—can use them, lowering costs. b. Multi-Sensor Integration: By integrating LiDAR with thermal or hyperspectral sensors, for example, geographical data becomes richer. Artificial Intelligence & Automation: a. Automated Processing: LiDAR data processing is becoming more efficient thanks to machine learning techniques, which automate processes like feature extraction and point cloud classification. b. Deep Learning for Classification: Particularly in intricate settings like cities, deep neural networks are increasing the precision of point cloud classification. Open Data Projects: a. Data Sharing and Collaboration: Through the sharing of LiDAR datasets, open data initiatives are encouraging cooperation between academics, governmental organizations, and business personnel. b. Community Involvement: Including nearby communities in the processes of gathering and validating data improves the accessibility of geographic data. Because LiDAR technology allows for unprecedented precision in geospatial analysis, it has unquestionably become a cornerstone in the GIS business. LiDAR has many applications, from urban planning to terrain modeling. The incorporation of LiDAR data into GIS workflows is expected to become more widespread as technological improvements continue to reduce costs and improve automation. This will open up new avenues for comprehending and managing our dynamic and complex world. If GIS specialists want to use LiDAR technology to its fullest in