Vegetation Indices
VEGETATION INDICES
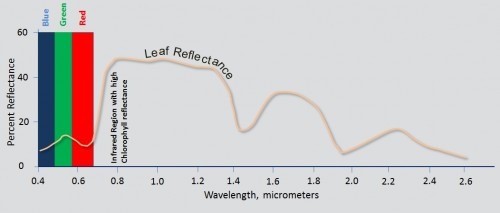
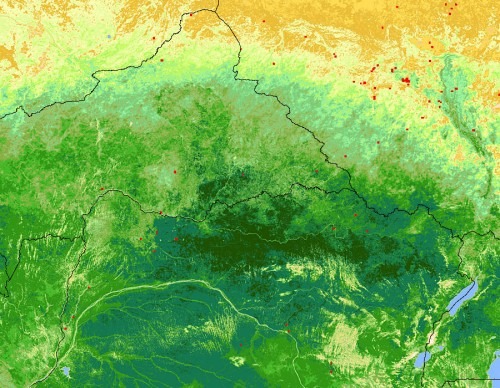
Healthy plants have a high NDVI value because of their high reflectance of infrared light, and relatively low reflectance of red light. Phenology and vigour are the main factors in affecting NDVI. An excellent example is the difference between irrigated crops and non-irrigated land. The irrigated crops appear bright green in a real-colour simulated image. The darker areas are dry rangeland with minimal vegetation. In a CIR (colour infrared simulated) image, where infrared reflectance is displayed in red, the healthy vegetation appears bright red, while the rangeland remains quite low in reflectance.
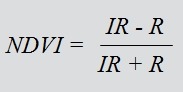
Where:
NDVI = Normalised Difference Vegetation Index
IR = Infrared band of the electromagnetic spectrum
R = Red band of the electromagnetic spectrum.
NDVI values vary between -1 to +1. NDVI is extensively used in assessment of vegetation health world-over. The NDVI Map is used for scouting and the creation of management zones. This long established vegetation index works well under intermediate conditions when plant growth is not too abundant. However, during the early stages of the crop, when the green leaf area is still small, it is highly sensitive to soil background effects induced by tillage, crop residues, or moisture. It also tends to saturate once the heavy crops have reached canopy closure.
In addition to NDVI there are many other indices that have developed by the scientists. Some of these are:
- Vegetation Condition Index (VCI)
- Leaf Area Index (LAI)
- General Yield Unified Reference Index (GYURI)
- Temperature Crop Index (TCI)
- Enhanced Vegetation Index(EVI)
Date Requirements:
Vegetation indices are available as frequently as possible for a given area. Therefore sensors capable of acquiring high temporal resolution data are preferred. SATPALDA provides data from SPOT 2-5, DMC Constellation and SPOT 6. These are sensors specifically tailored to covered large area in a single scene.