GIS Applications in Civil Engineering
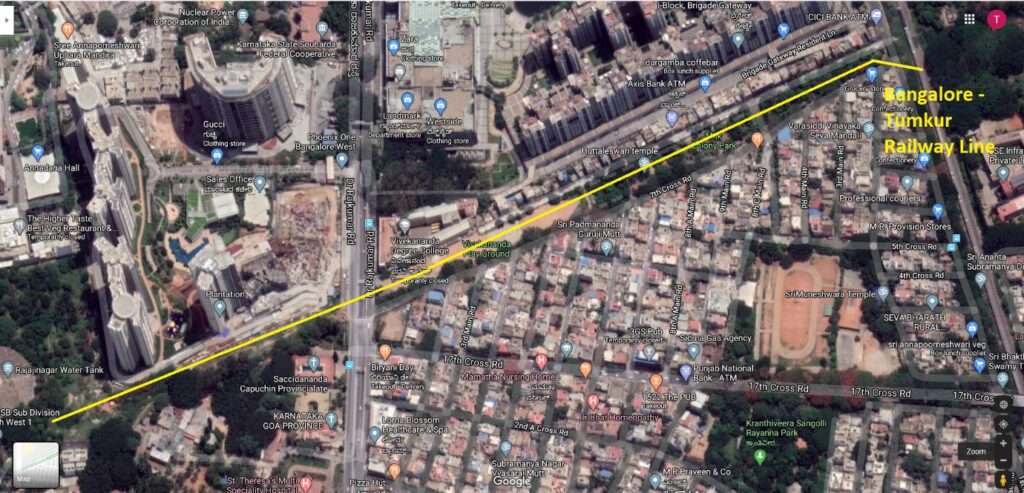
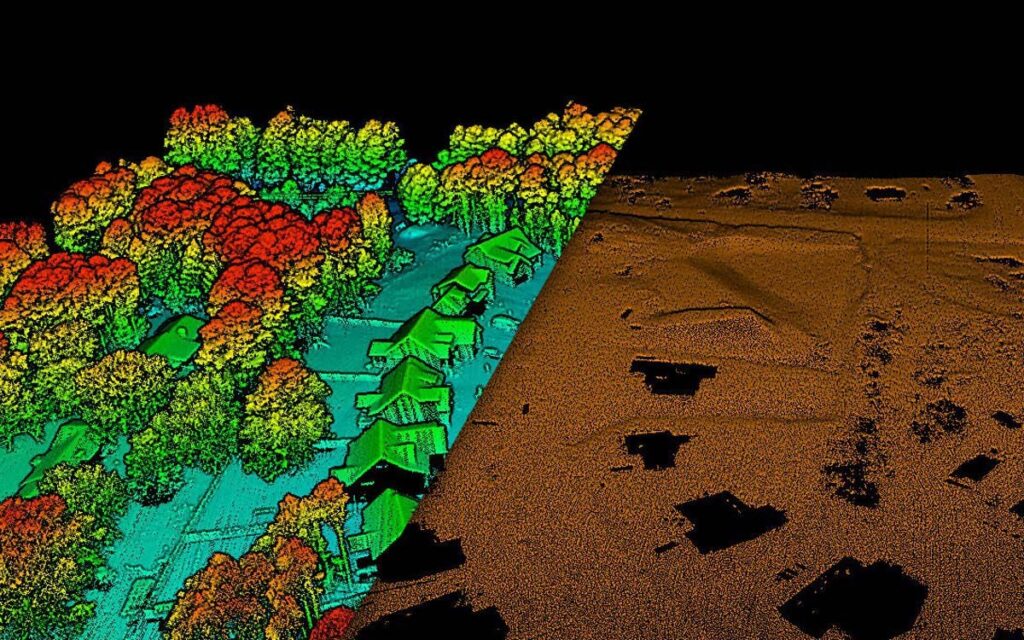
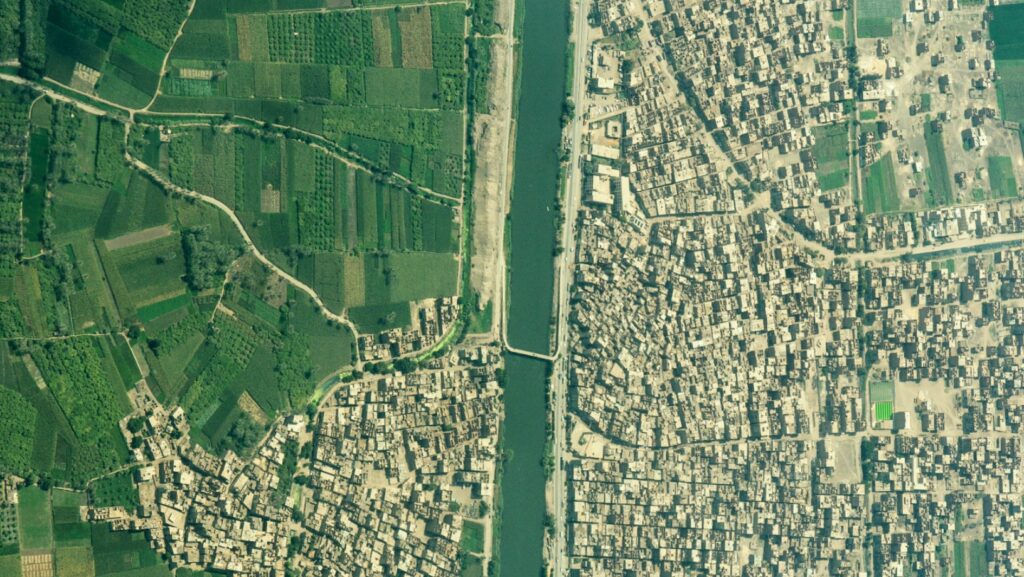
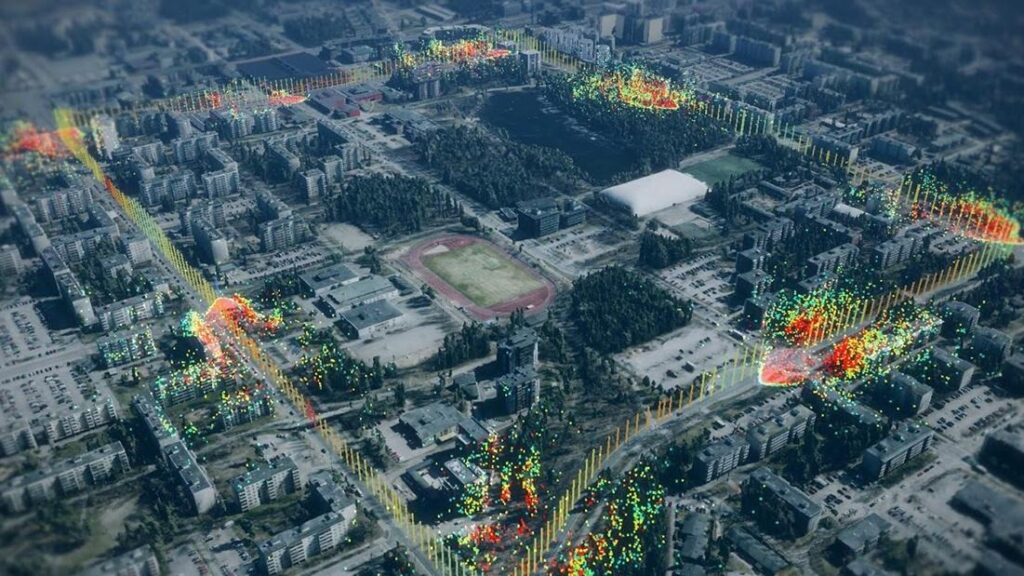
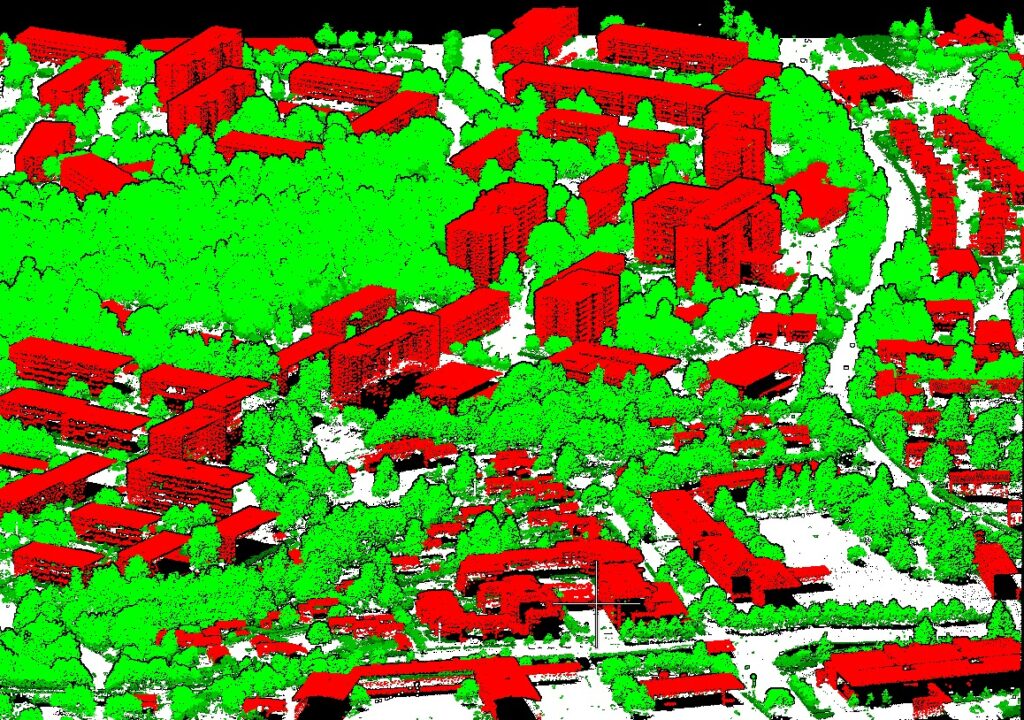
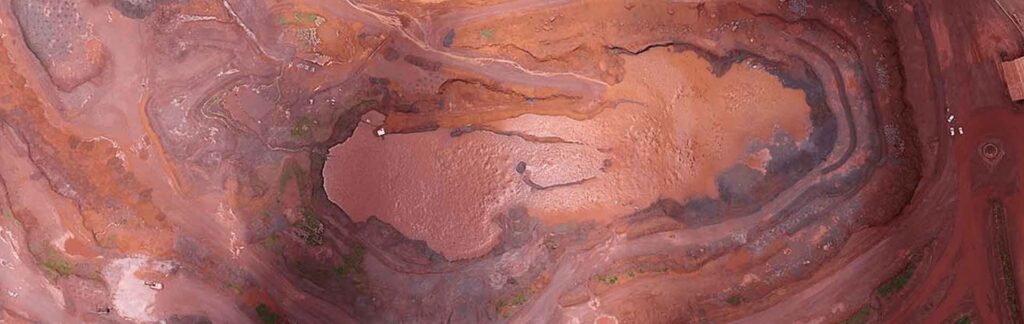
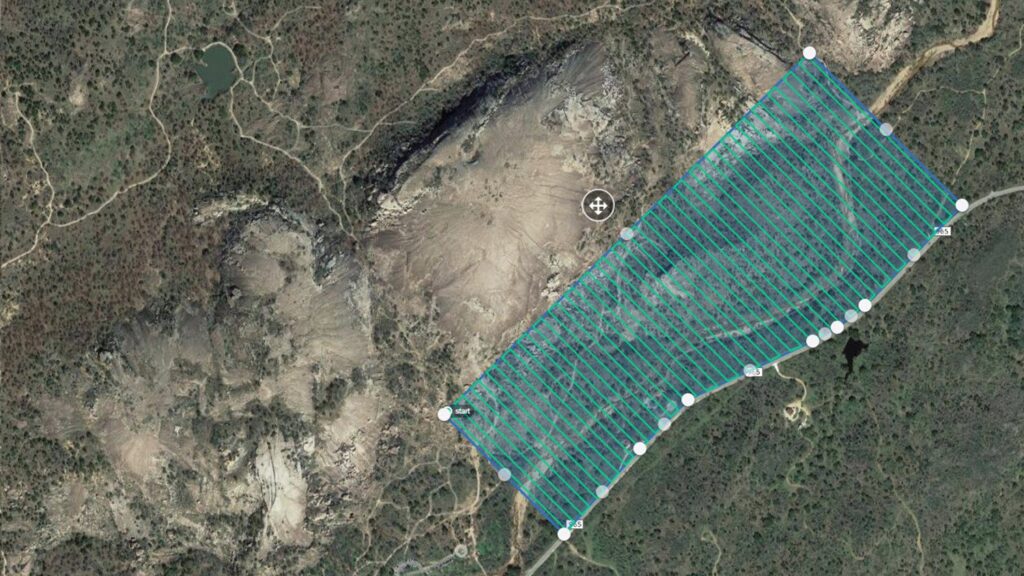
Geographic Information System technology is now widely used in many different industries with significant applications in civil engineering and the spatial viewpoint provided by GIS improves the planning, design, building and maintenance of civil engineering projects. This process will examine the complex network of GIS applications in civil engineering and how they transform how we think about developing infrastructure. Understanding GIS in Civil Engineering Management of Spatial Data: The ability to handle and interpret spatial data is fundamental to GIS and spatial data in civil engineering refers to details regarding the precise location, dimensions and forms of features on Earth’s surface. With the use of GIS, engineers may combine information from multiple sources, including survey data, topographic maps and satellite imagery to create a complete picture of the project region. Site Planning and Selection: GIS helps civil engineers choose the best locations for infrastructure projects where professionals can evaluate variables including geography, resource proximity and environmental considerations by superimposing various layers of spatial data. This makes well-informed decisions easier to make early in the project planning process. Terrain Analysis: In civil engineering, topographic data is essential particularly for projects involving slope stability, drainage and grading and with the use of GIS tools, engineers may analyze the land’s aspect, slope and elevation in detail. This data is essential for making sure that structures are stable and for creating effective drainage systems. Utility Infrastructure Management: GIS is essential to the administration of sewage and water systems among other utility infrastructure. Engineers can track maintenance activities, plan for future expansions and produce detailed maps of the infrastructure that is currently in place by integrating spatial data where utility networks are more dependable and efficient overall when this proactive approach is implemented. Phases of GIS Applications in Civil Engineering Project Feasibility and Preliminary Design: GIS tools help determine a project’s viability in the early phases of a civil engineering project where engineers can analyze aspects like accessibility, environmental impact and land use. GIS aids in locating possible obstacles and improving the initial design by considering geography. Detailed Design and Engineering: GIS is still a useful tool as the project moves on to the detailed design phase and with the use of GIS, engineers may produce intricate maps and drawings that include precise spatial data. This makes it easier to precisely design infrastructure parts by accounting for the spatial interactions between various components. Construction Phase: By offering real-time geographical information, GIS systems help expedite the construction phase. Construction managers can properly manage resources, keep track of where construction equipment is located and monitor progress with the use of GIS and by doing this, mistakes and delays are reduced and the construction process is guaranteed to follow the intended design. Asset Management and Maintenance: GIS is still essential for asset management and maintenance even after a civil engineering project is finished. Engineers may more easily schedule maintenance tasks, evaluate the state of infrastructure and plan for future upgrades by using detailed spatial information to construct asset inventories. Advanced GIS Technologies in Civil Engineering Light Detection and Ranging (LiDAR): High-resolution elevation data is provided by LiDAR technology when combined with GIS. LiDAR is very helpful in civil engineering for mapping floodplains, modeling terrain and locating possible landslide regions and the exact elevation data acquired by LiDAR improves the engineering analyses’ correctness. Remote Sensing: The use of remote sensing technologies such as aerial photography and satellite imagery, greatly enhances GIS applications in civil engineering and with the use of these technologies, engineers may monitor changes in the project area, evaluate the influence on the environment and gather data for project planning and management. These technologies also give high-resolution and current geographical data. 3D Modeling: Three-dimensional modeling is now supported by advanced GIS software giving engineers a more immersive way to see projects and by offering a realistic depiction of the landscape and architecture, 3D modeling improves the design process. This enhances comprehension of the project overall and facilitates improved communication among project stakeholders. Some Case Studies Planning and Design of Highways: A significant highway extension project’s planning and design were greatly aided by GIS and it was used by engineers to optimize the alignment of the new route, study traffic patterns and evaluate the impact on the environment. This method reduced the negative effects on the surrounding ecology while simultaneously increasing the efficiency of the design process. Urban Infrastructure Development: GIS is frequently used in urban environments to build infrastructure projects like sewage and water supply networks. Engineers can create the infrastructure that minimizes environmental effects while meeting the demands of an expanding population by combining demographic data with spatial data. Disaster Response and Recovery: In the context of disaster management and recovery, geographic information systems (GIS) are incredibly useful and with the use of GIS, it is possible to quickly assess the areas affected by a natural disaster like an earthquake or hurricane. Spatial data is a useful tool for engineers to design evacuation routes, locate damaged infrastructure and efficiently coordinate rescue and recovery activities. Applications of geographic information systems have completely changed the field of civil engineering by giving professionals strong instruments for organizing, designing and overseeing infrastructure projects. GIS improves decision-making by bringing a spatial perspective to every stage of the project lifecycle from site selection to asset management. The accuracy and productivity of civil engineering procedures are further improved by the integration of GIS with cutting-edge technologies like LiDAR, remote sensing and 3D modeling and even if there are still obstacles, continued research and development in GIS technology should solve these problems and encourage even more innovation in the sector. GIS capabilities can be utilized by civil engineers to effectively navigate the spatial elements of their projects among the intricate network of infrastructure development. As time goes on, the combination of GIS and civil engineering will play a crucial role in creating a future where infrastructure is not only sustainable and functional but also closely linked to the changing spatial environment in which
GIS Applications in Civil Engineering Read More »