satpalda

Aerial Photogrammetry

Aerial Photogrammetry

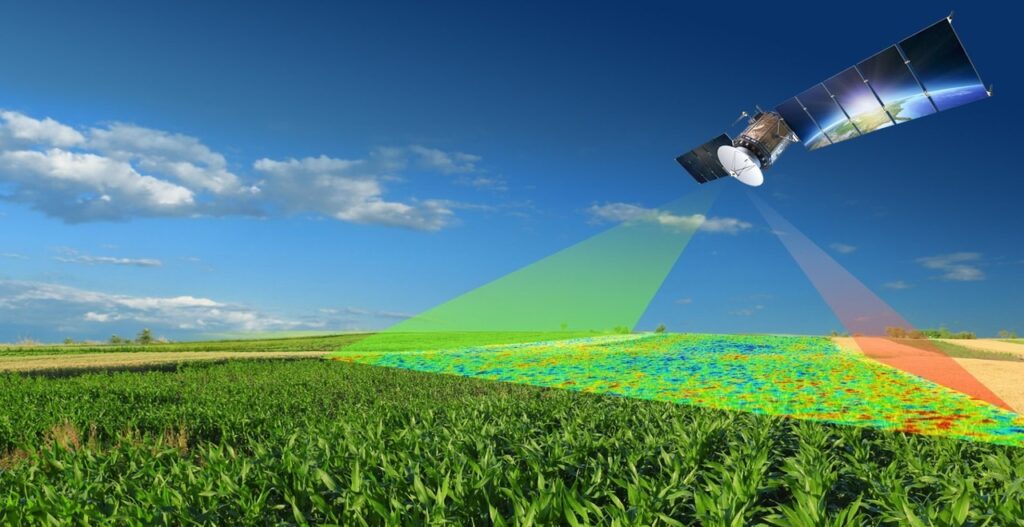
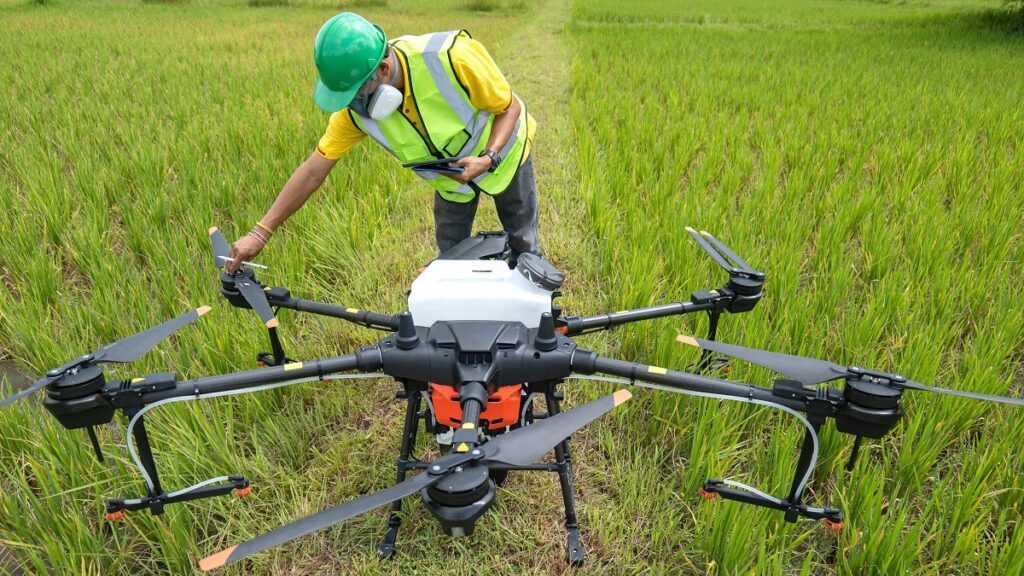
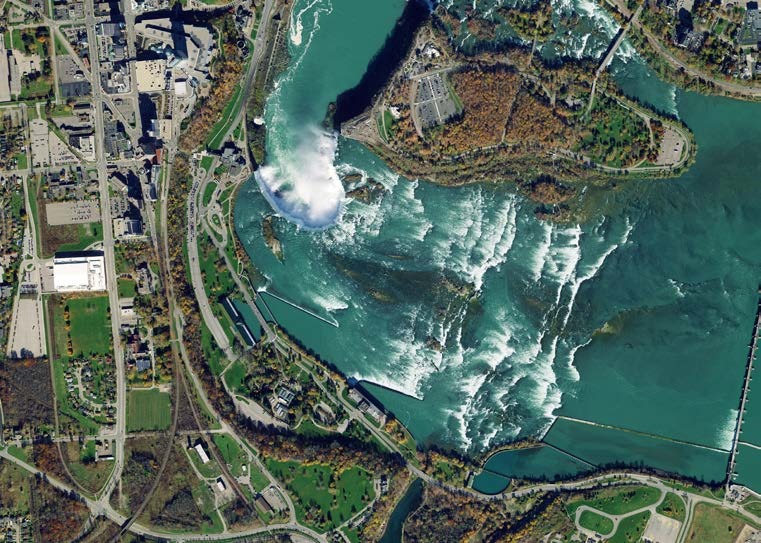
Aerial photogrammetry is a cutting-edge method in Geographic Information Systems (GIS) that enhances mapping and spatial analysis with never-before-seen precision and efficiency and this cutting-edge technique produces incredibly accurate and detailed maps by fusing photogrammetric concepts, surveying and aerial images. What is Aerial Photography in Photogrammetry? Aerial photography in photogrammetry is a pivotal technique within the GIS industry employing high-resolution imagery captured from airborne platforms and this method uses stereoscopic vision to retrieve 3D data making it easier to map and model terrain precisely. By using digital elevation models (DEMs) and orthophotos, experts examine changes in the topography, land use and environment. Geospatial information is calculated by photogrammetric software and accuracy is ensured via ground control points. This technique which is essential to Geographic Information Systems (GIS) improves disaster management, urban planning and spatial analysis. In photogrammetry, aerial photography provides a thorough understanding of landscapes promoting sustainable development and well-informed decision-making in the geospatial domain. Principles of Aerial Photogrammetry Aerial photogrammetry is based on stereo vision which is the process of taking overlapping aerial photos from various angles which makes it possible to create spatially accurate maps and 3D models. Camera Calibration: Accurate measurements depend on precise camera calibration and to guarantee accurate data gathering, parameters including focal length, lens distortion and sensor properties need to be calibrated. Applications of Aerial Photogrammetry Topographic Mapping: Detailed topographic maps are made possible in large part by aerial photogrammetry where it makes height, geography and land feature more accurately represented by taking high-resolution photos and using exact measurement methods. Urban Planning and Development: Aerial photogrammetry is used in urban planning to help with infrastructure design, land use assessment and change tracking where this technology gives planners precise data so they may make well-informed decisions supporting smart city initiatives. Environmental Monitoring: Aerial photogrammetry improves the effectiveness of monitoring environmental changes such as deforestation, land degradation or natural disasters where high-resolution imagery capturing makes it possible to analyze environmental conditions in great detail. Precision Agriculture: Aerial photogrammetry helps agricultural practices by giving farmers comprehensive information about crop health, soil conditions and irrigation requirements. This data-driven strategy enhances overall farm management and maximizes resource allocation. Future Trends Advanced Sensor Technologies: Developments in sensor technology, particularly in the areas of multispectral and hyperspectral imaging are advantageous to aerial photogrammetry where these sensors record information that is not apparent to the human eye which enables more thorough analysis in applications such as mineral prospecting, vegetation health monitoring and land cover classification. Machine Learning and AI Integration: Data processing and analysis are being revolutionized by the combination of aerial photogrammetry, machine learning and artificial intelligence where algorithms for automated feature extraction, object recognition and change detection are becoming a crucial part of GIS processes since they drastically cut down on manual labor and accelerate project completion times. Real-Time Data Processing: Aerial photogrammetry is becoming more advanced due to the need for real-time data where GIS specialists can now process and analyze data instantly because of the development of sophisticated computing technology. This allows for quick decision-making and response in areas like emergency response, infrastructure monitoring and disaster management. Enhanced 3D Modeling: Thanks to advancements in processing power and algorithms, aerial photogrammetry is moving toward more complex 3D modeling methods where detailed terrain research, urban planning and simulation applications are made possible by high-fidelity 3D models which give stakeholders a more engaging and informative experience. At the vanguard of GIS technology, aerial photogrammetry provides unmatched spatial mapping accuracy and detail where the field of mapping and spatial analysis has changed significantly as a result of the developments in stereo vision, camera calibration and the incorporation of cutting-edge technology like Lidar and UAVs. Prospects for the interaction between aerial photogrammetry and GIS are bright, as difficulties are met and technology advances opening up new avenues for precision mapping and spatial intelligence.

Aerial Photogrammetry Read More »

Topographical Survey

What Is A Topographical Survey

A topographical survey is an intricate mapping procedure that records and depicts a landscape’s physical characteristics encompassing both natural and artificial components where making an accurate and thorough representation of the terrain’s surface is the main goal to facilitate precise spatial analysis and well-informed decision-making. Topographical surveys are essential foundations that offer priceless information for a variety of uses starting from environmental management to urban planning. What are the Objectives of a Topographic Survey? Accurate Spatial Data Collection: Gathering precise spatial data about the target area is the main goal of a topographical survey which calls for the use of sophisticated surveying tools like Total Station equipment, LiDAR (light detection and ranging) and GPS (global positioning system). With the aid of these tools, surveyors can record exact topographical features like elevation and coordinates. Terrain Modeling and Visualization: Detailed terrain models and representations are frequently among the goals where surveyors can transform gathered data into three-dimensional landscape representations by using sophisticated GIS software. This helps planners and decision-makers make more informed decisions by improving comprehension and communication of the topographical aspects. Land Use and Land Cover Identification: The purpose of topographical surveys is to locate and record patterns of land use and land cover within the surveyed area where mapping vegetation, water features, structures, roads and other infrastructure components are all included in this. GIS specialists can plan infrastructure development, evaluate environmental impact and make judgments about land management by having a thorough understanding of these characteristics. Accuracy in Elevation Data: An essential component of topographical surveys is elevation data where the elevation-related goals center on taking exact measurements to produce precise contour maps. These maps are very helpful for determining drainage patterns, estimating slope gradients and designing construction projects that take the topography into account. Methods of Topographic Surveying LiDAR Technology: LiDAR technology measures the separation between a sensor and the surface of the Earth using laser beams and by using an airborne or ground-based device, LiDAR creates extremely precise three-dimensional point cloud data by scanning the environment. Detailed topographical maps are made using this data as a basis. Aerial Photography: Aerial photography is the process of taking detailed pictures of the Earth’s surface using drones or airplanes and after that, information about the topography and elevation is extracted from these photos. When it comes to efficiently covering broad regions, aerial surveys are especially useful. GPS and GNSS (Global Navigation Satellite System): These technologies enable exact location data collection during field surveys by providing accurate positioning information. Using GPS data in conjunction with other survey techniques improves topographical maps’ overall accuracy. Surveying Tools: For ground-level measurements in topographical surveys and traditional surveying tools like total stations and theodolites are still used where these tools support the thorough data collection procedure when paired with contemporary technologies. Uses of Topographical Surveys Urban Planning: Topographical surveys are essential for giving comprehensive information about the infrastructure, elevation and land characteristics that are currently in place. City planners can use this data to help them make well-informed decisions about infrastructure development, transit networks and zoning. Environmental Management: To evaluate and track changes in the environment, GIS experts use topographical surveys. Knowing the topography of the area is useful for planning conservation initiatives, identifying places that are vulnerable to erosion and evaluating the effects of natural disasters. Infrastructure Development: Topographical surveys are used by engineers and architects to plan infrastructure projects and for building roads, bridges and other constructions that blend in smoothly with the surrounding environment, precise elevation data and terrain information are essential. Natural Resource Management: Topographical surveys play a significant role in the sustainable management of natural resources including water bodies and forests where authorities can put into practice efficient conservation and resource utilization policies by having a thorough awareness of the terrain. Benefits of Topographical Survey Precision Mapping and Data Accuracy: The capacity to produce extremely precise and thorough mapping of the terrain is fundamental to topographical surveys and with the use of sophisticated surveying tools like GPS receivers and Total Stations, GIS specialists are able to record elevation information, contours and land features with unmatched accuracy. Because of its high degree of precision, the GIS databases are filled with trustworthy data which paves the way for solid spatial analysis and modeling. Terrain Analysis and Hydrological Modeling: Hydrological modeling and terrain analysis are made possible by topographical surveys which are essential for GIS applications where GIS experts can identify possible locations vulnerable to erosion or landslides by carefully gathering elevation data which they can then use to create precise digital elevation models (DEMs) and perform slope analyses. The foundation of GIS applications is topographical surveys which offer a precise and comprehensive depiction of the Earth’s surface where the creation of incredibly detailed and educational maps has been made possible by the revolutionary combination of cutting-edge technologies like GPS, LiDAR and remote sensing. Topographical surveys play a crucial part in forming our perception of the real world and assisting with well-informed decision-making in a variety of fields, even as the GIS sector develops.

What Is A Topographical Survey Read More »

Land Use Land Cover Mapping

What Is Land Use Land Cover Mapping

Land Use Land Cover Mapping – The term “land use” describes the uses and operations that are performed on a plot of land including commercial, industrial, agricultural and residential uses and in contrast, land cover refers to the biological and physical cover of the Earth’s surface including urban areas, agricultural fields, forests and water bodies. The incorporation of these two elements into GIS makes it easier to create thorough LULC maps providing a comprehensive perspective of the terrain and to manage natural resources, urban planning, environmental monitoring and disaster response, accurate LULC mapping is essential. It supports the application of sustainable land-use practices, the assessment of changes over time and the identification of prospective development sites. A key component of Geographic Information System technology, Land Use Land Cover (LULC) mapping is essential to comprehending and managing the Earth’s surface and this complex procedure offers important insights into the spatial distribution of natural and man-made characteristics by classifying and illustrating the various land use and land cover categories within a given area. Significance of Land Use Land Cover (LULC) Maps LULC maps are dynamic tools that show the various land cover and use categories within a given geographic area where understanding the changing landscape and how it affects ecosystems, the climate and human activity requires knowledge of this information. GIS specialists use cutting-edge tools and techniques to produce precise and current LULC maps which greatly aid in well-informed decision-making. Urban planning is one of the main uses for LULC maps where understanding the allocation of residential, commercial, industrial and recreational spaces becomes crucial for sustainable urban development as cities grow and their populations rise. Urban planners can utilize LULC maps to gain a thorough understanding of land use patterns which helps them decide on zoning, infrastructure development and resource allocation. A further important area where LULC maps are essential is environmental monitoring where scientists can evaluate the effects of human activities such as deforestation, urbanization and agricultural expansion, on ecosystems by examining changes in land cover over time. Developing conservation plans, tracking biodiversity and lessening the consequences of climate change all depend on this information. LULC mapping and natural resource management are intrinsically related where accurate data on land use and cover is crucial for maintaining forests, managing water resources and improving agricultural operations. GIS specialists provide comprehensive LULC maps that support the sustainable management of natural resources by utilizing satellite images, remote sensing and ground-truthing techniques. Why do we need LULC Maps? Urban planners and other decision-makers use LULC maps as a basic tool to comprehend the geographical distribution of different land use types in a given area and with precise technical language like ‘feature extraction’ and ‘classification algorithms,’ GIS specialists may use high-resolution satellite imagery analysis to produce LULC maps that illustrate the complex interplay of natural, agricultural and urban land uses. City planners may make more informed decisions about resource distribution, zoning laws and infrastructure development with the help of this spatial intelligence. LULC maps provide important insights into changes over time in the context of environmental management making it possible to spot patterns and trends in the dynamics of land cover and with ‘change detection algorithms,’ GIS experts can keep an eye on changes to the water, vegetation and urban sprawl. This capacity is essential for determining how human activity affects ecosystems enabling sustainable land management techniques, and endorsing programs designed to preserve biodiversity. Another area where LULC maps are essential is in the assessment of natural resources. ‘Spectral analysis’ methods are used by GIS experts to identify various land cover types including wetlands, farms and wood where governments and other resource-planning groups need this information to maximize land usage for forestry, agriculture and other purposes. Disaster risk reduction and emergency response preparation are two other uses for LULC maps. GIS specialists use these maps in disaster-prone areas to pinpoint weak points and evaluate possible threats and by using sophisticated methods such as “vulnerability mapping” and “hazard analysis,” experts may create plans to lessen the effects of calamities like earthquakes, wildfires and floods. LULC maps provide a basic framework for modeling and simulating possible disaster scenarios which helps with the creation of efficient evacuation plans and the distribution of resources in emergencies. Applications of LULC Maps Urban Planning and Development: Land Use and Land Cover (LULC) maps are an important tool for urban planners as they assist in making well-informed decisions on resource allocation, infrastructure development and zoning. Reducing environmental impact, regulating urban growth and enhancing overall livability are all made possible by accurate land use information. Natural Resource Management: To monitor and manage natural resources including wetlands, forests and agricultural land, governments and environmental organizations utilize LULC maps and for the sake of conservation and sustainable resource use, this information is essential. Disaster Management: LULC maps help emergency responders organize rescue and relief efforts and identify the affected areas after natural catastrophes like floods, wildfires or earthquakes where planning for future disaster resilience and identifying susceptibility are made easier by the information. Agriculture: To maximize crop management, precision agriculture significantly depends on LULC maps where farmers may make more efficient and productive decisions by using these maps to aid in crop selection, irrigation and pest management. Climate Change Studies: LULC mapping plays a crucial role in examining how land cover patterns are affected by climate change where scientists can better comprehend environmental transitions by identifying changes in vegetation, deforestation and urban expansion by comparing maps across time. Use of Land A fundamental component of GIS, land cover mapping provides a thorough picture of the Earth’s surface and its dynamic changes and as techniques and technology progress, LULC mapping keeps developing and is now a vital tool for well-informed decision-making across a range of industries. Future LULC mapping will be shaped by the collaboration of GIS experts, remote sensing technology and cutting-edge algorithms which will support environmentally friendly land management practices.

What Is Land Use Land Cover Mapping Read More »

High resolution Satellite Imagery

High-resolution Satellite Imagery

High-resolution satellite imagery obtained by Earth observation satellites allows for the detection and distinction of smaller objects and features on the surface of the planet and this type of photography is known as high-resolution satellite imaging. A crucial factor in determining an image’s level of detail is its spatial resolution which is commonly expressed in meters per pixel. The GIS sector has seen a notable rise in satellite imaging resolution as a result of technological advancements, making mapping more exact and accurate and with the advent of high-resolution satellite photography, the rapidly developing discipline of Geographic Information Systems has completely changed how we view and study the Earth’s surface. The combination of state-of-the-art satellite technology and GIS applications has created new opportunities for unprecedentedly detailed resource mapping, monitoring and management on our globe. Satellite Platforms and Sensors High-resolution imagery is gathered by several satellite platforms each of which has sensors designed for a particular purpose. For example, optical sensors record images in the visible and infrared ranges while synthetic aperture radar (SAR) sensors are capable of penetrating cloud cover to yield important information about the Earth’s surface even in inclement weather. Leading constellations of satellites, like those run by Planet Labs, Airbus and Maxar Technologies have led the way in providing high-resolution satellite photography and with its 31-centimeter panchromatic and 1.24-meter multispectral resolution, WorldView-3, an advanced satellite in the MAXAR constellation is well-known for providing unmatched clarity and detail. Applications Urban Planning and Development: High-resolution imagery facilitates urban planners in detailed land-use mapping, infrastructure development and monitoring urban sprawl where the ability to discern individual buildings, roads and vegetation aids in making informed decisions for sustainable urban development. Natural Resource Management: GIS professionals leverage high-resolution satellite imagery for precise mapping of natural resources including forests, water bodies and agricultural lands which enables efficient resource management, monitoring of deforestation and assessing the health of ecosystems. Disaster Monitoring and Response: During natural disasters such as earthquakes, floods or wildfires, high-resolution satellite imagery plays a crucial role in assessing the extent of damage identifying affected areas and planning emergency response efforts. The rapid availability of up-to-date imagery aids in swift decision-making. Environmental Monitoring: Monitoring environmental changes such as deforestation, pollution and land degradation is essential for sustainable environmental management where high-resolution imagery assists in tracking these changes over time providing valuable insights for conservation efforts. Precision Agriculture: High-resolution satellite imagery aids precision agriculture by offering detailed insights into crop health, soil conditions and pest infestations where farmers can make data-driven decisions to optimize crop yield, reduce resource usage and enhance overall productivity. Future Trends Exciting opportunities lie ahead for high-resolution satellite imagery in the GIS sector and it is anticipated that continuing advancements in satellite technology will push the limits of spatial resolution even beyond giving GIS specialists previously unheard-of levels of detail. Small satellite constellations and miniature satellites or “CubeSats” are becoming increasingly commonplace and provide quick and affordable ways to image the surface of the Earth. Furthermore, it is projected that the combination of high-resolution images with additional geospatial data sources like LiDAR and drone imagery will produce extensive datasets for more precise and thorough mapping. The integration of various data sources will improve GIS experts’ analytical skills and allow for a more profound comprehension of spatial linkages and patterns. A key component in the development of the GIS sector, high-resolution satellite imagery adds a level of precision and depth to the mapping and monitoring of the Earth’s surface where the GIS community can use high-resolution images to tackle difficult problems as technology develops starting from disaster response and precision agriculture to urban planning and environmental management. Even while there are still technological difficulties, advances in satellite technology, cloud computing and artificial intelligence are opening the door to more effective and scalable solutions. Prospects are promising as a result of the ongoing integration of high-resolution satellite imagery with other geospatial information which will enable GIS specialists to make wise judgments and help create a more resilient and sustainable future.

High-resolution Satellite Imagery Read More »

What is SAR data? Synthetic Aperture Radar Explained.

Synthetic Aperture Radar SAR is an active remote sensing technology that utilizes microwave signals to acquire detailed and precise images of the Earth’s surface and unlike optical sensors that rely on sunlight, SAR operates independently of weather conditions and can capture data day or night. The “synthetic aperture” refers to the creation of a virtual antenna aperture by moving a physical antenna along the flight path of an airborne or spaceborne platform. The radar transmits microwave pulses towards the Earth’s surface and the echoes from these pulses are recorded where the recorded signals are then processed to create high-resolution images offering a unique perspective that complements optical and other remote sensing data. SAR data, therefore, encompasses the information obtained from these radar signals and the subsequent processing steps that transform raw data into interpretable images. Applications of SAR Data in GIS Land Cover Classification: SAR data is widely employed in land cover classification due to its ability to penetrate clouds and vegetation where the distinctive backscatter signatures of different land cover types, as captured by SAR, enable accurate classification and mapping of urban areas, agricultural fields, forests and water bodies. Disaster Monitoring and Response: SAR data plays a crucial role in disaster monitoring and response efforts and in the aftermath of natural disasters such as earthquakes, floods or hurricanes, SAR imagery helps assess the extent of damage, identify areas of displacement and facilitate rapid response planning. The all-weather capability of SAR is particularly valuable in emergencies where optical sensors may be hindered by adverse weather conditions. Environmental Monitoring; SAR technology contributes significantly to environmental monitoring by providing detailed information on changes in vegetation structure, soil moisture and land deformation. This is particularly relevant for applications such as deforestation detection, wetland mapping and monitoring the impact of climate change on the Earth’s surface. Infrastructure Monitoring: SAR data is employed in monitoring critical infrastructure such as bridges, dams and pipelines and by detecting subtle deformations or movements in infrastructure components, SAR aids in the early identification of potential issues contributing to the maintenance and safety of essential structures. Levels of SAR Data Level-0 SAR Data: At its rawest form, Level-0 SAR data represents the unprocessed radar signal received by the satellite sensor and this data contains the raw radar echoes and other auxiliary information such as spacecraft and sensor parameters. Level-0 data is essential for further processing and calibration but is rarely used directly in GIS applications due to its complexity. Level-1 SAR Data: Level-1 SAR data marks the beginning of data processing for practical applications and it involves the calibration of Level-0 data to correct for sensor-specific artifacts and atmospheric effects. Calibration transforms the raw radar signal into calibrated radar backscatter values, measured in decibels (dB). Level-1 data is essential for basic applications like topographic mapping and change detection. Level-2 SAR Data: Moving up the processing ladder, Level-2 SAR data involves further refinement and enhancement and this level includes the geocoding process where radar imagery is transformed into geographic coordinates using precise orbit and Digital Elevation Model (DEM) information. Level-2 data is often used for regional mapping, land cover classification and environmental monitoring. Level-3 SAR Data: Level-3 SAR data involves the compilation and synthesis of multiple Level-2 SAR datasets for broader analysis and it includes the generation of mosaics or time-series datasets facilitating the monitoring of long-term changes in the Earth’s surface. Level-3 data is crucial for applications such as crop monitoring, deforestation analysis and infrastructure development planning. Level-4 SAR Data: The highest level of processed SAR data, Level-4, focuses on specific applications or customized products and this level often involves data fusion with other remote sensing sources such as optical imagery or thermal data, to provide comprehensive and detailed information for specialized studies. Level-4 data is employed in applications like disaster management, precision agriculture and urban planning. A mainstay of the GIS sector, Synthetic Aperture Radar (SAR) data provides a distinct viewpoint on the surface of the Earth and its great spatial resolution, versatility and all-weather capabilities make it an essential instrument for tracking and comprehending our planet. The combination of SAR and GIS will surely spur innovation and advance our capacity to handle difficult problems about environmental change, disaster relief and sustainable development as technology develops.

What is SAR data? Synthetic Aperture Radar Explained. Read More »

What is a Point Cloud

What is a Point Cloud?

A collection of data points specified in three dimensions is called a point cloud. Concerning the physical world, every point in the cloud is uniquely identified by its X, Y and Z coordinates where these datasets are often gathered through the use of several remote sensing technologies such as photogrammetry or LiDAR (Light Detection and Ranging) which makes it possible to create incredibly precise and thorough reconstructions of the Earth’s surface. The use of point clouds, a basic component of Geographic Information Systems has completely changed how humans view and process spatial data. Numerous points in space make up these three-dimensional datasets which are an abundant supply of data for modeling, mapping and comprehending the real world. Applications of Point Clouds Topographic Mapping: Point clouds play a crucial role in topographic mapping providing detailed information about the Earth’s surface and LiDAR-derived point clouds, for instance, enable the creation of Digital Elevation Models (DEMs) and Digital Terrain Models (DTMs) facilitating accurate representation of terrain variations. Urban Planning: In urban planning, point clouds assist in the creation of 3D city models where these models are instrumental in visualizing and analyzing the built environment aiding planners in making informed decisions related to infrastructure development, zoning and land use. Environmental Monitoring: Point clouds are employed in environmental monitoring to assess changes in landscapes such as deforestation, land degradation or the impact of natural disasters where the high precision of point cloud data allows for detailed analysis of terrain alterations over time. Infrastructure Management: Civil engineers and infrastructure planners utilize point clouds for assessing and managing transportation networks, utilities and other critical infrastructure. The ability to accurately capture and represent the built environment supports efficient asset management and maintenance. Archaeological Studies: Archaeologists leverage point clouds for detailed documentation and analysis of archaeological sites where this technology aids in the preservation of cultural heritage by creating precise 3D models of artifacts, structures and excavation sites. Attributes of Point Clouds Intensity: One important characteristic linked to every point in a point cloud is intensity and it displays the laser pulse’s strength or return signal which is used to collect LiDAR (Light Detection and Ranging) data. The intensity values give surface reflectivity information which helps distinguish between various materials and facilitates feature classification. Color Information: Depending on extra sensors or pictures, each point in some point clouds has a color assigned to it and this feature improves the data’s visual representation and helps with applications like environmental monitoring, land cover classification and terrain mapping. A more comprehensive dataset for analysis is produced when color and geographical information are combined. Time Stamp: This is an important feature for dynamic situations, particularly when mobile LiDAR systems are involved as it enables the investigation of temporal changes by logging the time at which each point was recorded. In applications where understanding changes over time is crucial such as transportation planning, time-stamped point clouds are useful. Density: The quantity of points in a given region is referred to as point cloud density where surfaces and features can be represented in more detail with point clouds that have a higher density. In applications like forestry where precisely recording the structure of plants is crucial, density is an important feature. Functions of Point Clouds Terrain Modeling and Visualization: Terrain modeling is one of the main uses of point clouds in GIS where a precise depiction of the Earth’s surface is offered by point clouds which makes it easier to create high-resolution Digital Surface Models (DSMs) and Digital Elevation Models (DEMs). Applications such as landform classification, watershed analysis and floodplain mapping depend on these models. Point clouds provide GIS experts with unmatched precision for visualizing and analyzing topographical data which helps with land use and environmental management decision-making. Augmented Reality and Virtual Reality Applications: New opportunities in GIS have been made possible by the integration of point clouds with augmented reality (AR) and virtual reality (VR) technology where users can engage with and explore three-dimensional spatial information by visualizing point cloud data in immersive environments. This skill can be used in simulation exercises, architectural design and urban planning to give stakeholders dynamic and realistic representations that help them make more informed decisions. Change Detection and Monitoring: Point clouds are an effective tool for tracking changes over time and detecting changes where GIS analysts can recognize and measure changes in the environment by comparing numerous point cloud datasets that were obtained at various times in time. This capacity is especially helpful for tracking urbanization, keeping an eye on the growth of plants and evaluating the effects of natural disasters. The capacity to recognize minute alterations in the terrain facilitates well-informed decision-making about environmental preservation, disaster management and sustainable growth. Point clouds have become indispensable opening up new avenues for spatial analysis and comprehension where point cloud data has a wide range of uses starting from topographic mapping to urban planning and beyond. Point clouds can greatly influence how we perceive the world around us as long as technology keeps developing overcoming obstacles and accepting new ideas. The GIS community is poised to make even more strides with further research and development, therefore point clouds will undoubtedly remain a key component in the digital transformation of spatial analysis.

What is a Point Cloud? Read More »

Remote Sensing and GIS for Agriculture

Technology has become a key factor in today’s agricultural scene guiding the sector toward previously unheard-of levels of sustainability and efficiency and one such pair of technologies that have become more well-known is Geographic Information Systems (GIS) and Remote Sensing (RS). The way farmers and agricultural professionals approach land management, crop monitoring and decision-making processes has changed dramatically as a result of these innovative instruments. Remote Sensing in Agriculture The process of gathering data about a thing or phenomenon without making direct physical contact is known as remote sensing which is used in agriculture to gather data about the Earth’s surface using a variety of sensors, usually installed on satellites or unmanned aerial vehicles (UAVs). Types of Remote Sensing: Passive Remote Sensing: This technique collects data by relying on radiation from the outside world, including sunshine where typical passive sensors are radiometers and cameras. Active Remote Sensing: In this method, sensors release radiation of their own and gauge the reaction whereas active sensors include LiDAR (Light Detection and Ranging) and radar. GIS in Agriculture GIS is a powerful tool for spatial analysis, data management and visualization and in agriculture, GIS integrates various data sources facilitating a holistic understanding of the landscape. Spatial Data in GIS: Vector Data: Utilizes points, lines and polygons to represent features on the Earth’s surface where fields, roads and infrastructure can be mapped using vector data. Raster Data: Represented as a grid of cells, each with a specific value, raster data is crucial for mapping continuous phenomena like temperature, precipitation and soil moisture. Crop Yield Estimation and Crop Risk Detection Using technology to its full potential is essential for sustainable and effective crop management in the modern era of agriculture and the integration of Geographic Information Systems (GIS) with Remote Sensing (RS) for precise agricultural yield estimation and risk identification is one such ground-breaking method. Utilizing satellite and aerial photography, remote sensing gathers information on a range of surface features. This technology is essential for evaluating crop health tracking growth patterns and spotting any hazards in the agricultural setting. By offering a geographical foundation for organizing and evaluating this data, GIS enhances RS and helps to create a full precision agriculture system. A key component of agricultural planning and crop yield estimation is substantially improved by RS and GIS and through the analysis of satellite-captured spectral signatures, these technologies allow farmers to evaluate the health of their crops. With the use of multispectral and hyperspectral images, small changes in plant health can be detected enabling focused actions. Then, using GIS, this data is transformed into insights that can be put into practice producing intricate maps that show locations with high and low yield potential and with the use of this knowledge, farmers are better equipped to allocate resources efficiently and raise total productivity. Efficient Field Visits: Precision agriculture has been revolutionized by the integration of Remote Sensing and Geographic Information Systems where this technology reduces the need for frequent field visits enhancing the accuracy and efficiency of agricultural operations. Satellite and aerial imagery provide a bird’s-eye view of agricultural landscapes allowing GIS software to process and analyze this data. Technologies like NDVI and drones capture real-time data on crop conditions allowing for comprehensive analysis without the need for field visits. GIS also allows for detailed maps to optimize resource allocation and yields minimizing costs and environmental impact. Study of Growth Cycle of a Crop: Precision agriculture has been significantly enhanced by the integration of Remote Sensing (RS) and Geographic Information Systems (GIS) where RS technologies provide high-resolution imagery for monitoring crop health and assessing environmental conditions and GIS allows for spatial analysis of agricultural data enabling detailed maps of crop distribution and soil properties. It also aids in temporal analysis tracking changes in crop conditions over time. GIS techniques aid in data-driven decisions, such as crop yield prediction and pest infestation identification. Crop Insurance Management and Crop Health Monitoring The integration of Remote Sensing (RS) and Geographic Information Systems (GIS) in agriculture has revolutionized crop health monitoring and insurance management where RS allows farmers to acquire real-time data about their crops enabling the detection of subtle changes in crop health. GIS provides a spatial context to this data allowing farmers to analyze and interpret it in a geospatial framework. NDVI or Normalized Difference Vegetation Index is a crucial metric derived from RS data indicating crop vitality. GIS overlays this information onto spatial maps enabling farmers to pinpoint areas requiring attention and implement targeted interventions and the integration of RS and GIS also helps in crop insurance management allowing insurers to conduct more precise risk assessments and customize policies based on actual risk exposure. RS and GIS also contribute to early warning systems predicting potential threats to crops and enabling farmers and insurers to proactively mitigate risks, ultimately safeguarding agricultural productivity. Precision, efficiency and sustainability have become the hallmarks of a new era marked by the integration of GIS and remote sensing where farmers and agricultural specialists are empowered to make data-driven decisions by the technological complexities of these technologies which range from spectral bands to spatial data integration. The combination of remote sensing and geographic information systems is expected to become more and more important in tackling the issues posed by an expanding world population and guaranteeing food security for future generations as technology develops.

Remote Sensing and GIS for Agriculture Read More »

Pipeline Monitoring

Pipeline Monitoring and Surveillance

The efficient and secure transportation of oil and gas through pipelines is crucial and as the network of pipelines continues to expand globally, the need for robust monitoring and surveillance systems becomes paramount. GIS technology has emerged as a powerful tool in this regard providing a comprehensive solution for pipeline operators to ensure the integrity and safety of their infrastructure. At its core, GIS integrates geographical data and spatial analysis to provide valuable insights for decision-making and in the context of pipeline monitoring, GIS serves as the backbone for creating a spatial database that encompasses the entire pipeline network. This spatial database incorporates diverse datasets, such as topography, land use, environmental conditions, and existing infrastructure. This comprehensive GIS framework enables operators to visualize, analyze and interpret data, facilitating informed decision-making in real time. Real-Time Monitoring and Data Integration One of the key advancements in pipeline surveillance is the integration of real-time monitoring systems into GIS platforms. Advanced sensors, including satellite imagery, drones, and IoT devices, continuously gather data along the pipeline route. This real-time data is then seamlessly integrated into the GIS framework, providing operators with up-to-the-minute information on various parameters, including temperature, pressure, flow rate, and environmental conditions. Through the integration of real-time data, GIS allows operators to identify anomalies or potential issues promptly. For instance, sudden changes in temperature or pressure can be indicative of leaks or structural weaknesses. GIS tools enable operators to visualize these changes spatially, pinpointing the exact location and facilitating rapid response measures. Predictive Analytics and Risk Assessment: GIS technology plays a crucial role in predictive analytics for pipeline monitoring. By analyzing historical data and incorporating machine learning algorithms, GIS platforms can predict potential risks and vulnerabilities along the pipeline route. This proactive approach allows operators to implement preventive measures, reducing the likelihood of accidents and minimizing downtime. Risk assessment within GIS involves the analysis of multiple layers of data, including the proximity to population centers, environmental sensitivity, and geological factors. Through spatial analysis, GIS can identify high-risk areas and prioritize them for regular monitoring and maintenance activities. This approach enhances the overall safety and reliability of the pipeline infrastructure. Emergency Response Planning: GIS is instrumental in developing comprehensive emergency response plans for pipeline incidents. In the event of a leak or other emergency, GIS platforms provide real-time information on the affected area, allowing emergency responders to quickly assess the situation and plan an effective response. The GIS framework incorporates data on surrounding infrastructure, road networks, and evacuation routes. This spatial information enables responders to navigate the terrain efficiently and evacuate affected areas promptly. Furthermore, GIS assists in the coordination of response efforts by providing a centralized platform for communication and data sharing among relevant stakeholders. Environmental Monitoring and Compliance: Environmental stewardship is a critical aspect of pipeline operations, and GIS technology contributes significantly to environmental monitoring and compliance. GIS platforms enable operators to overlay pipeline routes with ecological data, identifying environmentally sensitive areas and implementing measures to minimize impact. Moreover, GIS facilitates compliance with regulatory requirements by providing a transparent and auditable record of pipeline operations. This includes tracking adherence to safety standards, environmental regulations, and reporting obligations. GIS-generated reports can be instrumental in regulatory submissions, demonstrating a commitment to environmental responsibility and compliance with industry standards. Integration with Remote Sensing Technologies: The integration of GIS with remote sensing technologies has revolutionized pipeline monitoring. Satellite imagery and aerial surveys, when integrated into GIS platforms, provide high-resolution spatial data that enhances the accuracy of monitoring systems. These technologies offer a bird’s-eye view of the entire pipeline network, enabling operators to detect potential issues such as encroachments, land subsidence, or vegetation encroachment. By regularly updating satellite imagery and aerial surveys, GIS ensures that operators have access to the most current information, aiding in proactive maintenance and risk mitigation. This integration also supports the identification of unauthorized activities near the pipeline, contributing to overall security measures. Cybersecurity for Pipeline Monitoring: As pipelines become more connected through digital technologies, the importance of cybersecurity in GIS cannot be overstated. Protecting the integrity of the GIS platform is crucial to prevent unauthorized access, data breaches, and potential disruptions to pipeline operations. Advanced encryption methods, secure data transmission protocols, and regular cybersecurity audits are essential components of GIS platforms for pipeline monitoring. Implementing robust cybersecurity measures ensures the confidentiality, integrity, and availability of sensitive pipeline data, safeguarding against cyber threats and potential attacks. The integration of GIS technology into pipeline monitoring and surveillance has ushered in a new era of efficiency, safety, and environmental responsibility. The real-time monitoring capabilities, predictive analytics, and seamless integration with remote sensing technologies empower pipeline operators to make informed decisions and respond rapidly to emerging issues. As the GIS industry continues to evolve, further advancements in artificial intelligence, machine learning, and data analytics will likely enhance the capabilities of pipeline monitoring systems. The synergy between GIS and pipeline surveillance not only ensures the integrity of the infrastructure but also contributes to a sustainable and secure energy transportation network for the future.

Pipeline Monitoring and Surveillance Read More »

GIS for Disaster Mitigation & Emergency Response

GIS for Disaster Mitigation & Emergency Response

Spatial or geographic data can be gathered, analyzed and presented digitally using GIS technology where decision-makers may visualize, interpret and comprehend the relationships, patterns and trends within the data thanks to the integration of location-based information. GIS is essential for improving situational awareness, streamlining risk assessment and assisting with well-informed decision-making in disaster management. Geographic Information Systems are becoming increasingly important in disaster mitigation and emergency response in an era where natural disasters occur more frequently and with greater intensity. A thorough framework for comprehending, assessing and controlling disasters is provided by geographic information systems, a potent technology that combines spatial data and information. Spatial Decision Support Systems (SDSS) Spatial Decision Support Systems (SDSS) represent a specialized category within GIS that focuses on providing decision-makers with tools and capabilities to analyze and interpret spatial information effectively where SDSS combines geospatial data with decision models enabling users to evaluate various scenarios and make informed decisions. In disaster management, SDSS proves invaluable by offering real-time insights supporting risk assessment and aiding in formulating effective response strategies. Key Components in Disaster Management Gathering and Combining Spatial Data: GIS depends on gathering and combining spatial data from a range of sources such as ground-based sensors, satellite imaging and remote sensing and to make precise maps and evaluate the effects of disasters on a geographic scale, this information is essential. Risk Assessment and Hazard Mapping: Geographic information systems make it possible to identify and map probable hazards like hurricanes, wildfires, earthquakes and floods where authorities can more effectively allocate resources and prioritize mitigation activities by superimposing danger maps over sensitive locations. Early Warning Systems: By combining real-time data from weather stations, earthquake monitors and other sources, GIS makes it easier to create early warning systems and this lessens the possible effect of disasters by enabling the implementation of evacuation plans and timely alerts. Resource Allocation and Logistics: By examining the spatial distribution of impacted areas and pinpointing crucial locations for intervention, GIS aids in the most efficient deployment of resources during emergency response and it helps with logistical planning by guaranteeing the strategic deployment of resources and response teams. Community Involvement and Communication: GIS facilitates interaction and cooperation between the several parties involved in disaster management where public education, awareness-raising and community participation are all aided by interactive maps and visualizations. Case Studies Hurricane Response in the Gulf Coast: Geographic Information System was crucial in the region’s hurricane response where authorities were able to evaluate susceptible areas, prepare evacuation routes and forecast the path of hurricanes by employing geographic analysis. Coordination between emergency teams was made easier by real-time GIS data which also guaranteed a prompt and efficient reaction to the crises. Wildfire Management in California: The use of GIS technology has been extremely beneficial to California’s wildfire management. Geographic Information System assists in identifying high-risk regions for wildfires by analyzing historical data. GIS makes it possible to track the spread of a fire in real-time during an emergency which helps with resource allocation and evacuation planning. Earthquake Preparedness in Japan: Japan, situated in a seismically active region relies heavily on GIS for earthquake preparedness where GIS tools are used to map fault lines, assess building vulnerability and plan evacuation strategies. SDSS capabilities enable authorities to simulate earthquake scenarios and devise effective response plans. Geospatial information systems, particularly when combined with spatial decision support systems, have become indispensable in the disaster management domain and its capacity to evaluate risks, offer real-time geographical insights and aid in decision-making has completely changed how societies anticipate and handle crises. Building resilient communities and guaranteeing efficient disaster mitigation and emergency response plans will depend on utilizing GIS to its fullest extent as the frequency of natural catastrophes continues to rise.

GIS for Disaster Mitigation & Emergency Response Read More »

Digital Farming Solutions for a Sustainable Future

As the global population continues to grow, the agriculture industry faces the pressing challenge of meeting the rising demand for food while minimizing its environmental impact and in this era of rapid technological advancement, digital farming solutions, underpinned by Geographic Information System technologies have emerged as a key driver for achieving sustainable agriculture practices. A Geographic Information System is a powerful tool that allows farmers to collect, analyze and interpret spatial data related to their fields and by utilizing various data layers including soil type, weather patterns and crop health, GIS enables farmers to make informed decisions for optimizing agricultural processes. This integration of location-based information enhances precision farming techniques, leading to more sustainable and efficient agricultural practices. Precision Farming and Resource Optimization Precision farming, also known as precision agriculture is a farming management concept that uses GIS technologies to optimize field-level management about crop farming and by employing GPS guidance systems, sensors and data analytics, farmers can precisely manage variability within fields ensuring that resources such as water, fertilizers and pesticides are used efficiently. GIS applications help farmers create detailed maps of their fields showing variations in soil properties and nutrient levels. This information enables farmers to implement variable rate applications adjusting inputs based on specific field conditions. For example, if a certain area of the field has higher nutrient levels, farmers can reduce fertilizer application in that region minimizing waste and environmental impact. Climate-Smart Agriculture The agriculture sector is particularly vulnerable to climate change with shifting weather patterns, unpredictable rainfall and extreme events impacting crop production where GIS plays a crucial role in climate-smart agriculture by providing tools for monitoring and adapting to changing climate conditions. GIS technologies can analyze historical weather data, predict future climate trends and provide valuable insights to farmers and by understanding how climate change may affect their region, farmers can make informed decisions on crop selection, planting times and irrigation practices. This proactive approach helps mitigate the risks associated with climate variability and ensures the long-term sustainability of agricultural practices. Water Management Water scarcity is a growing concern in agriculture and efficient water management is essential for sustainable farming where GIS technologies assist farmers in optimizing water usage through precise irrigation practices. By integrating data on soil moisture levels, weather forecasts and topography, farmers can implement irrigation strategies that minimize water wastage and maintain soil health. GIS also facilitates the monitoring of water resources helping farmers identify areas prone to water stress and this information enables the implementation of targeted water conservation measures such as the introduction of drought-resistant crops or the adoption of water-saving irrigation techniques. Crop Health Monitoring Monitoring the health of crops is vital for the early detection of diseases and pests allowing farmers to take timely action to prevent widespread damage where GIS technologies contribute to crop health monitoring by integrating data from various sources including satellite imagery, drones and on-the-ground sensors. Remote sensing technologies such as satellite imagery, provide high-resolution data on crop conditions. GIS applications analyze this data identifying areas of potential concern such as pest infestations or nutrient deficiencies and by pinpointing these issues, farmers can apply targeted interventions reducing the need for broad-spectrum pesticides and promoting sustainable pest management practices. Supply Chain Optimization The integration of GIS in agriculture extends beyond the farm gate to optimize the entire supply chain where GIS technologies facilitate better logistics, planning and decision-making throughout the agricultural supply chain starting from production to distribution. For example, GIS can assist in route optimization for transporting agricultural products reducing fuel consumption and carbon emissions and by analyzing transportation routes, GIS helps streamline the supply chain, minimizing delays and ensuring the timely delivery of fresh produce to markets. This not only enhances efficiency but also reduces the environmental impact associated with transportation. Policy Support and Land Use Planning GIS technologies provide valuable support for policymakers and land-use planners in making informed decisions related to agriculture and by mapping and analyzing land-use patterns, GIS helps identify areas suitable for agriculture taking into account factors such as soil quality, topography and water availability. Governments can use GIS to develop policies that promote sustainable land use practices protecting valuable agricultural land from urbanization or degradation. Additionally, GIS aids in the identification of ecologically sensitive areas ensuring the conservation of biodiversity while promoting responsible agricultural practices. Digital farming solutions, empowered by GIS technologies, are at the forefront of driving sustainable agriculture practices and the ability to collect and analyze spatial data enables farmers to make informed decisions, optimize resource usage and adapt to the challenges posed by climate change. As the world grapples with the need to feed a growing population while preserving the environment, the role of GIS in agriculture becomes increasingly pivotal and by embracing digital farming solutions, we can pave the way for a more sustainable and resilient future in agriculture.

Digital Farming Solutions for a Sustainable Future Read More »