Blogs

KazEOSat-1 Earth Observation Satellite

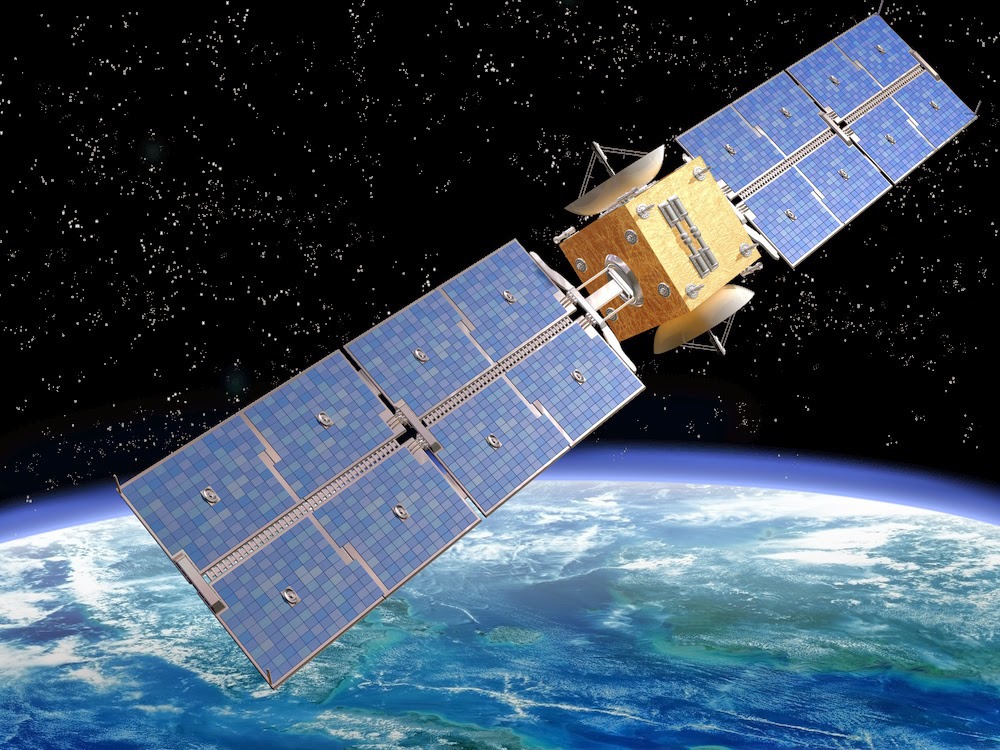
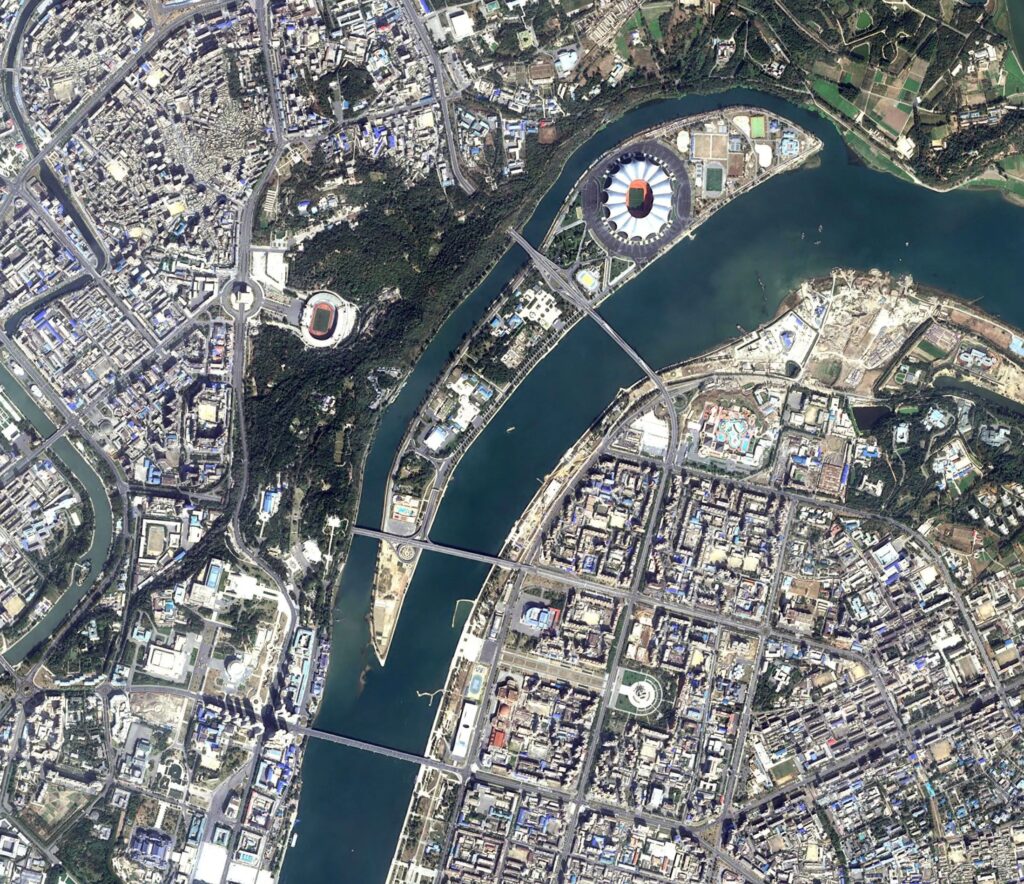
The persistent pursuit of state-of-the-art satellite technology in the field of Geographic Information Systems (GIS) has given rise to innovative platforms, with KazEOSat leading the way. The National Company “Kazakhstan Gharysh Sapary” (KGS) created this cutting-edge Earth observation satellite, which has completely changed the way that geospatial data is acquired and analyzed. This article explores the design, capabilities, and revolutionary effects of KazEOSat on the GIS sector, delving into the technical details of the satellite. Technical details: Altitude and Orbit: Because KazEOSat is in a sun-synchronous orbit, it can take pictures under constant lighting. At an altitude of roughly 600 kilometers, the satellite usually cruises at a perfect balance between coverage and spatial resolution. Imaging Device: The core of KazEOSat’s power is its sophisticated imaging system. The satellite’s high-resolution optical sensors allow it to take remarkably accurate multispectral and panchromatic images. The visible, near-infrared, and shortwave infrared spectra are among the multispectral bands that allow for a thorough examination of the surface features of the Earth. Resolution and Swath Width: The spatial resolution of KazEOSat is remarkable, frequently extending to sub-meter levels. Because of its ability to detect even the smallest details on Earth’s surface, this makes it a priceless instrument for a variety of uses, from agricultural monitoring to urban planning. The satellite’s broad sweep width further guarantees effective coverage, increasing its usefulness for large-scale mapping and disaster relief. Review Period: KazEOSat’s sophisticated propulsion system and nimble orbit allow it to accomplish an amazing revisit time. The capacity to quickly return to particular locations is essential for activities like documenting land use trends, keeping an eye on changing environmental conditions, and reacting quickly to catastrophes. Uses: Infrastructure Development and Urban Planning: The utilization of high-resolution pictures from KazEOSat has revolutionized the field of urban planning and infrastructure development. It makes it possible to map metropolitan areas in great detail, which makes it easier to plan land use, evaluate infrastructure, and find possible development locations. Agricultural Surveillance: KazEOSat is essential to precision farming, yield estimation, and crop monitoring in the agricultural industry. The evaluation of vegetation health, detection of pest infestations, and improvement of irrigation techniques are all made possible by the multispectral capabilities. Environmental Surveillance: KazEOSat records changes in land cover, deforestation, and the effects of climate change, all of which greatly aid in environmental monitoring. Assessing ecosystem health and identifying at-risk areas is made easier by the satellite’s capacity to collect data in a variety of spectral bands. Disaster Management: KazEOSat’s high-resolution imagery and quick revisit time make it a priceless tool for disaster management. The satellite is essential for improving resilience and response capacities since it can be used to measure the extent of natural catastrophes like floods, earthquakes, and wildfires as well as assist with post-disaster recovery operations. Connecting to GIS Platforms: Accessibility of Data: Users can easily obtain KazEOSat’s extensive dataset thanks to its smooth integration with GIS applications. Cloud-based services guarantee that geospatial experts may access, process, and display satellite imagery in their favorite GIS settings. Data Analysis and Processing: Sophisticated processing is applied to the raw imagery from KazEOSat to improve the overall quality and adjust for atmospheric aberrations and geometric image correction. Once this data has been processed, it can be used with GIS software to create precise geospatial models, perform in-depth spatial analysis, and detect changes. Open Data Projects: KazEOSat actively takes part in open data projects because it understands the collaborative aspect of GIS. The satellite promotes international cooperation in research, development, and disaster response by contributing to a worldwide repository of geographic information by making part of its data publicly available. Prospects & Innovations for the Future: Progress in Sensing Technology: The GIS sector is ever-changing, and KazEOSat is no exception. Continuous improvements in sensor technology could result in even greater spectral and spatial resolutions, broadening the scope of possible uses and increasing the accuracy of data interpretation. Integration of artificial intelligence: KazEOSat is probably going to incorporate AI algorithms for automatic feature recognition, change detection, and anomaly identification as AI continues to advance in the field of geospatial research. This will expedite the process of deriving significant insights from the copious amounts of data that the satellite has collected. International Cooperation: International cooperation is essential to the future of Earth observation. With its strategic location, KazEOSat is expected to play a major role in international projects tackling global issues including deforestation, climate change, and disaster relief. Data exchange, cooperative research collaborations, and the creation of defined protocols for satellite data interoperability are all examples of collaborative activities. KazEOSat is proof of the Earth observation satellites’ ever-growing potential in the GIS sector. The technological capabilities of this tool, along with its numerous uses, have raised the bar for geospatial data analysis and gathering. Future developments combined with the incorporation of KazEOSat into GIS workflows hold the potential to open up new avenues for comprehending the dynamic landscape of Earth. Not only is KazEOSat’s voyage a scientific marvel, but it is also a revolutionary force that will shape geospatial intelligence in the future.  

Aerodrome Mapping Database (AMDB)

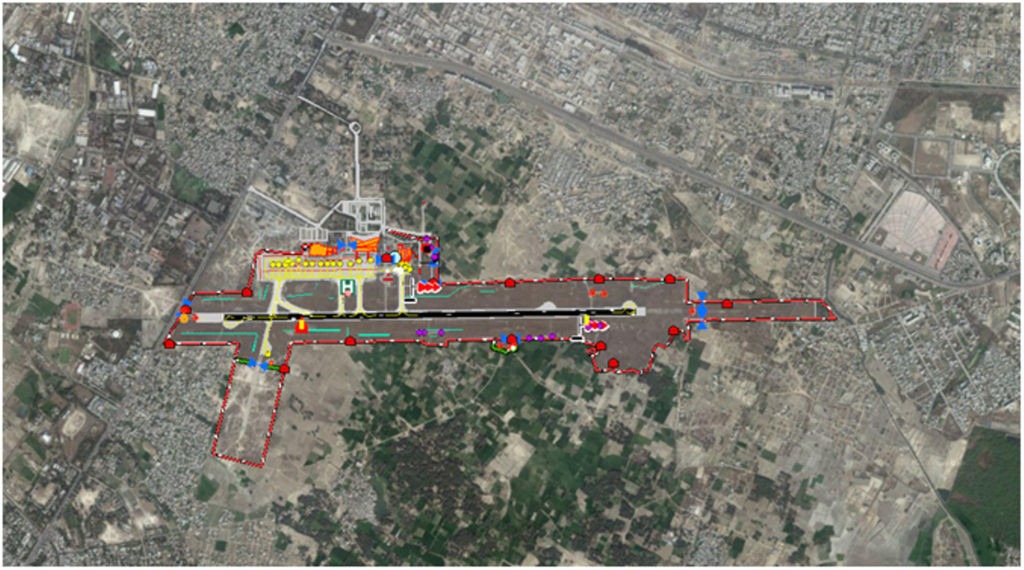
  In the fast-paced world of aviation, accuracy and safety are critical. Accurate and current geographical information is critical to the aviation industry’s ability to navigate and plan operations. The Aerodrome Mapping Database (AMDB) is a crucial element in this situation. Aeronautical information management relies on this advanced tool, which has its roots in the GIS (Geographic Information System) business, to ensure safe and effective air travel. Understanding Aerodrome Mapping GIS Integration in Aviation: GIS is a potent technology that is widely used in the aviation industry. It is capable of capturing, analyzing, and presenting geographic data. The handling of spatial data has been completely transformed by incorporating GIS into aeronautical information management. A subset of GIS called the Aerodrome Mapping Database is dedicated to thoroughly mapping aerodromes, offering a precise and in-depth depiction of airport elements. Aerodrome Mapping Components: Runways and Taxiways The accurate mapping of taxiways and runways is a crucial component of the Aerodrome Mapping Database. With the aid of GIS technology, intricate plans can be produced, complete with runway measurements, orientation, and taxiway routes. Pilots need to know this information when taking off, landing, and taxiing. Parking stands and aprons Another essential element documented in the database is the apron, which is the area where airplanes are parked, loaded, and unloaded. GIS makes it easier to identify and categorize parking spots, which guarantees effective space use and streamlined ground operations. Surface Obstacles With the use of GIS, airport obstacle surfaces can be identified, guaranteeing that no buildings or other natural features could endanger aircraft during takeoff or landing. For risk management and safety compliance, this thorough mapping is crucial. Lighting at Aerodrome Comprehensive data about aerodrome lighting systems can be found in the Aerodrome Mapping Database. This includes the positioning and features of lighting fixtures such as taxiway lights and runway lights that are essential for low-light operations and nighttime operations. Aids to Navigation Mapping navigational aids like Instrument Landing Systems (ILS), Very High-Frequency Omni-Directional Range (VOR) stations, and Distance Measuring Equipment (DME) is made possible thanks in large part to GIS technology. Precise aircraft navigation depends on the accurate portrayal of these aids. Features of Aerodrome Mapping Database Precision in Geometry: The AMDB meets industry standards like ICAO Annex 4, which outlines the necessary accuracy for airport mapping, by ensuring high precision in spatial data. Information Model (Features): Makes use of a strong data model with discrete feature classes for runways, taxiways, aprons, buildings, and navigational aids, among other aerodrome components. Integrity of Topology (Topology Rules): Complies with topological rules to preserve the connectivity and spatial relationships among various airport features, guaranteeing data integrity. Information about Attributes (Metadata Standards): These standards enable the description and documentation of attributes in metadata, hence promoting interoperability and comprehension of data. Dynamic Components (Time-sensitive Data): Contains the capacity to handle dynamic components like construction zones, temporary roadblocks, and other time-sensitive data pertaining to airport modifications. Importance of Aerodrome Mapping Database’s Importance Compliance with regulations and safety: In aviation, safety is the primary priority, and the Aerodrome Mapping Database is essential to maintaining it. The database helps ensure aircraft navigation is safe by offering precise and thorough spatial data. Moreover, it conforms to international aviation standards, such as those established by the International Civil Aviation Organization (ICAO). Effectiveness of Operations: The foundation of operational efficiency at airports is precise geographical data. The Aerodrome Mapping Database provides accurate information that pilots, air traffic controllers, and ground crew depend on to ensure efficient and well-coordinated operations. Using this information facilitates quick reactions to emergencies, efficient ground movements, and the best utilization of the runway. Planning for Emergency Reactions: It is essential to make decisions quickly and intelligently in emergency situations, such as airplane mishaps or unfavorable weather. The Aerodrome Mapping Database improves the efficacy of emergency response plans by giving emergency responders access to comprehensive geographic information, such as firefighting equipment locations, emergency exits, and access routes. Upcoming Developments in Aerodrome Mapping Automation and AI Integration: Automation and artificial intelligence (AI) integration are key components of the Aerodrome Mapping Database’s future. Automated procedures for gathering, verifying, and updating data will increase productivity and lower the possibility of mistakes. Artificial intelligence (AI) algorithms can aid in the study of complicated spatial data by providing insights that improve decision-making. Visualization and 3D Mapping: Aerodromes may now be mapped and visualized in three dimensions (3D) thanks to developments in GIS technology. This helps to clarify the spatial relationships between various parts and offers a more realistic picture of airport layouts. Training programs and flight simulators benefit greatly from 3D mapping. Streaming Data in Real Time: The need for up-to-date information in the aviation industry is growing. The Aerodrome Mapping Database’s integration of real-time data streaming capabilities enables instant updates on changing conditions, guaranteeing that all stakeholders have access to the most recent information. This is particularly important when hasty decisions are required. At the nexus of GIS technology and aviation, the Aerodrome Mapping Database is a vital tool for improving safety, productivity, and decision-making within the sector. The capabilities of this indispensable instrument will advance along with technology. The Aerodrome Mapping Database has a bright future ahead of it, one that will guarantee that the skies are safe and compassable for future generations. From precise runway and taxiway mapping to the incorporation of automation and artificial intelligence.      

Role Of Satellite Imagery in Disaster Management

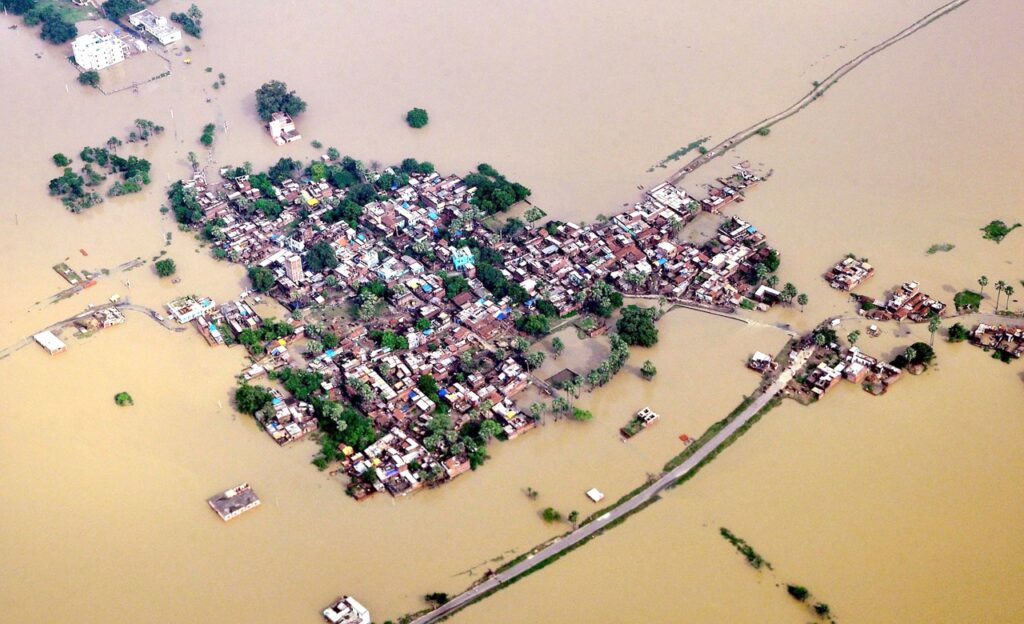
At a time when technology continues to redefine human capabilities, satellite imagery stands out as a crucial tool in disaster management. Satellite imagery and unmanned aerial vehicles (UAVs) have revolutionized disaster preparation, response, and recovery through the convergence of high-resolution satellite imagery. It plays a substantial role in disaster management, focusing on flood mapping, terrain modeling, and broader implications for geospatial industries. Due to its ability to provide real-time information, comprehensive coverage, and a bird’s-eye view of affected areas, satellite imagery has become an indispensable asset in disaster management. Particularly high-resolution satellite imagery has helped authorities assess the extent of damage, plan response strategies, and allocate resources more effectively. Flood mapping is one of the most important uses of satellite images in disaster management. Satellite technology can be used to successfully monitor and manage floods, a frequent and catastrophic natural calamity. Authorities can quickly and accurately map flooded areas by using high-resolution satellite images, which makes it possible to identify high-risk locations and arrange evacuation routes. Images taken by satellite sensors during a flood event are used to produce maps of the flood’s extent. These maps include important details on the places that are impacted, the water level, and the rate of flooding. Emergency responders can use this information to prioritize regions that require immediate care, plan rescue operations, and allocate resources more wisely. Drones or unmanned aerial vehicles (UAVs) offer a more granular and focused picture of disaster-affected areas than does satellite imaging, which gives a broad overview. Drones can be quickly deployed into regions that are too risky or inaccessible for ground teams to access in order to gather real-time data. These unmanned aerial vehicles are essential for disaster reconnaissance since they are fitted with high-resolution cameras or sensors. Drones can swiftly analyze the scene, identify survivors or casualties, and communicate this information to emergency crews in disaster response scenarios. UAVs can also be used for post-disaster damage assessment, which aids authorities in comprehending the effects on residential regions, vital facilities, and infrastructure. Not only is satellite imagery useful for evaluating the damage caused by natural catastrophes, but it is also essential for anticipating and making plans for future emergencies. Using satellite imagery for terrain modeling, which entails building three-dimensional depictions of landscapes, is a useful tool in disaster management. Geospatial experts can model terrains and identify places susceptible to particular natural disasters, such flash floods or landslides, by studying satellite data. By taking a proactive stance, authorities can fortify infrastructure, carry out preventive actions, and create evacuation plans for areas that are at risk. Offering a comprehensive and dynamic toolkit for assessing, responding to, and limiting the impact of natural disasters, satellite imagery has emerged as a game-changer in disaster management. The utilization of high-resolution satellite imagery in conjunction with other technology, such as drones, has greatly enhanced our capacity to comprehend and tackle the difficulties presented by natural disasters, ranging from mapping floods to modeling topography. The combination of cutting-edge technologies and satellite imagery will be crucial in forming more efficient disaster management plans as the geospatial industry develops. By combining precise aerial photos, real-time data, and predictive modeling, decision-makers are able to save lives and lessen the socioeconomic effects of natural catastrophes.

Differences Between DEM And DTM In GIS

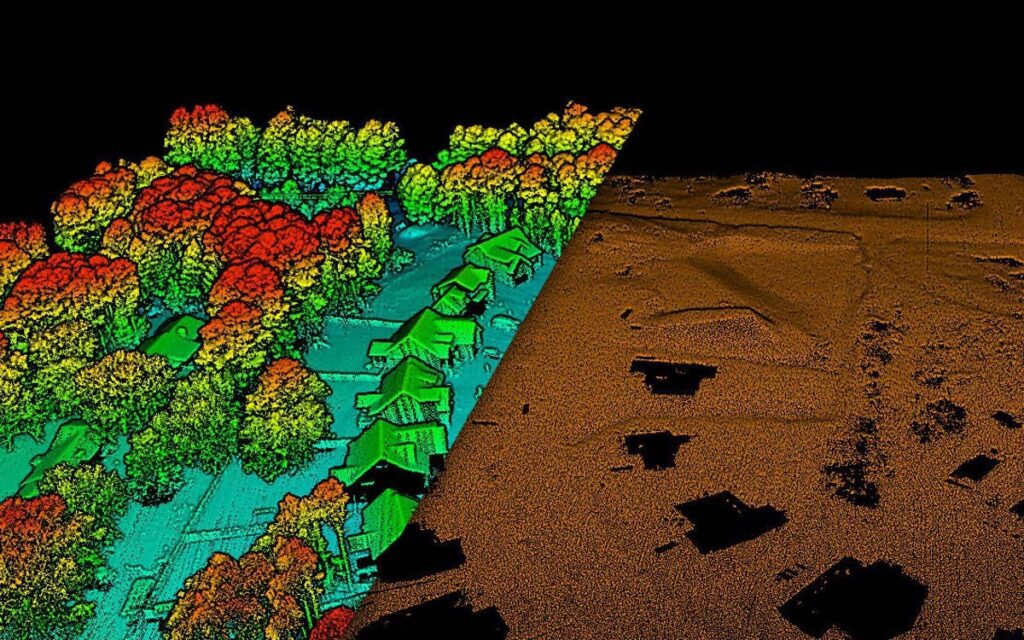
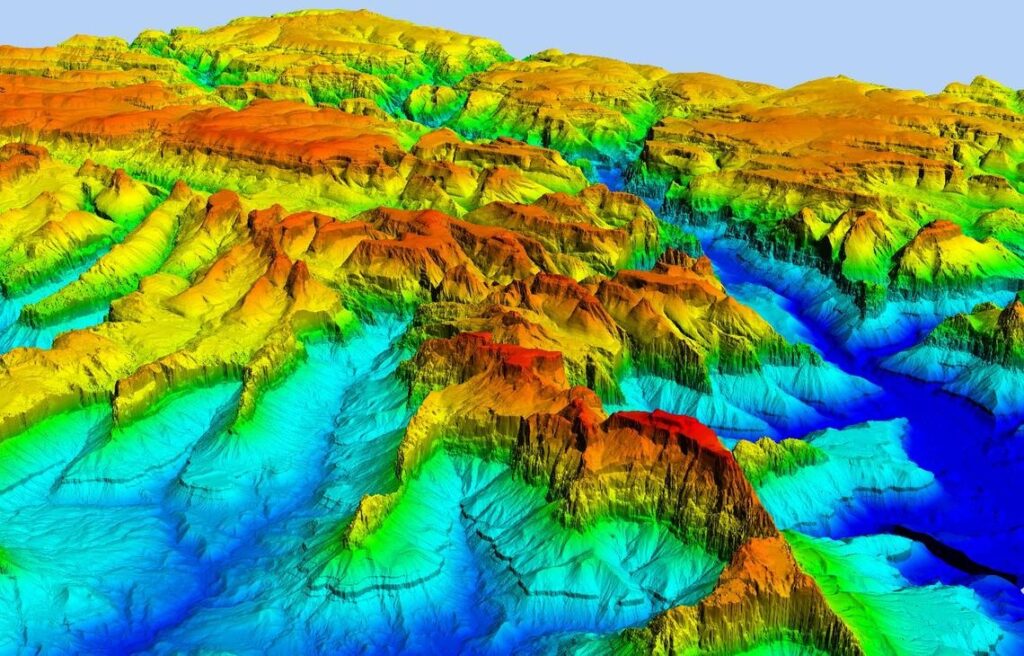
Precise terrain representation is critical to a wide range of Geographic Information Systems (GIS) applications, from environmental modeling to infrastructure development. Digital Terrain Models (DTM) and Digital Elevation Models (DEM) are two essential elements that are vital to the process of digitally representing the Earth’s surface. These models provide the foundation for many geospatial analyses and offer priceless insights into the subtle topographical details of landscapes. This article explores the definitions, distinctions, and uses of DTM and DEM in the GIS sector, delving into their technical details. Digital Terrain Model (DTM) A digital depiction of the unspoiled Earth’s surface, devoid of any above-ground elements like trees, structures, or infrastructure, is called a digital terrain model (DTM). A DTM’s main goal is to simulate the natural terrain by recording the elevation data at various locations throughout a region. The depiction is made possible by a gridded structure, in which each grid cell, or pixel, represents a distinct point on the surface of the Earth and holds the elevation data for that position. Typically, LiDAR (Light Detection and Ranging) surveys, photogrammetry, or measured ground points are the sources of data used to create DTMs. Because LiDAR can measure the distance between a sensor and the Earth’s surface, it can give high-resolution and accurate elevation data, making it a popular technology for creating DTMs. Principal Features of DTM Bare-Earth Representation: DTM removes any objects and structures that are situated above the ground in favor of representing only the ground surface. Elevation Points: A numerical number that indicates the elevation of the corresponding point on the Earth’s surface is contained in each pixel of a DTM grid. Spatial Resolution: A DTM’s spatial resolution plays a crucial role in dictating the amount of detail it can collect. More accurate depictions of the topography are provided by DTMs with higher resolutions. Sources of Data: Common sources for creating DTMs include ground surveys, photogrammetry, and LiDAR, each with pros and cons. Digital elevation Model in GIS (DEM) A more comprehensive definition of the Earth’s surface that includes above-ground elements like plants, buildings, and other structures is a digital elevation model (DEM). Although a DTM depicts the topography as it is, a DEM offers a more all-encompassing perspective by integrating both natural and artificial characteristics. Similar to DTM, DEM is shown as a gridded structure with elevation data contained in each cell. On the other hand, with DEM, things like buildings, trees, and other items that are present on the surface of the Earth may be included in the elevation data. Because of this, DEMs can be used in applications like urban planning and forestry management that need for a comprehensive depiction of the landscape. Application of Digital Elevation Model DEM: Entire Representation: With its combination of man-made and natural characteristics, DEM provides a more comprehensive depiction of the Earth’s surface. Uses in the Field of Urban Planning: In urban planning, digital elevation models (DEMs) are commonly used to represent topography in addition to building and road components. Fusion of Data: Data from a variety of sources, such as satellite photography, aerial surveys, and ground-based measurements, can be combined to construct DEMs. Modeling of Terrain and Infrastructure: DEMs are used to model infrastructural components that are essential for planning and development, in addition to the terrain. Differentiating DTM from DEM Even though DTM and DEM are frequently used synonymously, it’s important to understand their minor distinctions: DTM Exclusiveness: DTM ignores features that are above ground and concentrates only on the natural landscape. DEM, on the other hand, combines both natural and artificial components. Whole-Body Representation: Because DEM offers a more thorough depiction of the Earth’s surface, it is appropriate for applications that call for the inclusion of plants and buildings. Applications in GIS Both DTM and DEM find their place in distinct industries and are fundamental components of a wide range of GIS applications. Hydrological Modeling: DTMs are essential for hydrological modeling because they give data on how water moves through the landscape. Because of its inclusiveness, DEMs aid in the advancement of a more thorough knowledge of water movement in urban settings. Accurate Farming: High-resolution DTMs help gauge the differences in the landscape, and DEMs help gauge how structures affect farming methods in precision agriculture, where precise topographic data is essential. Urban Planning: Because they offer a comprehensive perspective of the built environment as well as the natural topography, DEMs are important tools for urban planning. This is quite helpful in determining how fresh innovations may affect the current environment. Modeling the Environment: In environmental modeling, DTMs are frequently used to assist researchers in simulating natural processes such as sedimentation, erosion, and habitat suitability. With their comprehensive perspective, DEMs help create a more accurate depiction of the surroundings. Upcoming Trends: The generation and usage of DTM and DEM provide rare obstacles despite their widespread use: Resolution of Data: Accurate depiction requires high-resolution data to be obtained. This problem is being overcome in part by improvements in LiDAR systems and other sensor technologies. Integration of Data: It has become easier to integrate data from multiple sources to produce smooth and precise models. Technological developments in data fusion methods and interoperability standards are necessary to overcome the upcoming problems. Automation and Machine Learning: One emerging field is the integration of machine learning techniques for automated feature extraction and model building. This can greatly simplify the process of generating DTM and DEM. Digital Elevation Models (DEM) and Digital Terrain Models (DTM) are essential tools in the complex field of GIS that help visualize and comprehend Earth’s topography. Because DEMs include both natural and man-made characteristics, they offer a more comprehensive view than DTMs, which concentrate on the raw natural terrain. These models have many uses in a wide range of industries, including urban planning and environmental modeling. The problems of data resolution, automation, and integration are being solved as technology develops, opening the door to more precise and effective DTM and DEM production. These models are constantly being improved

What Is Aerial Triangulation In Photogrammetry

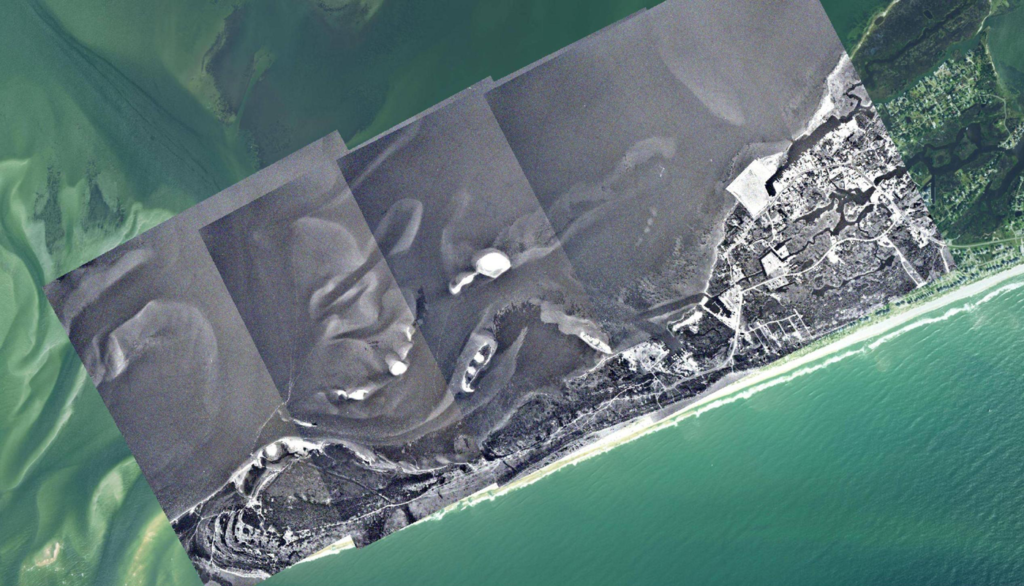
Geographic Information Systems (GIS) provide unmatched insights into the physical world and have completely changed how we study and interpret spatial data. Aerial triangulation is one of the many GIS techniques that is essential to precise mapping and geospatial analysis. This complex procedure, which is deeply ingrained in the field of photogrammetry, is essential to the conversion of aerial pictures into accurate geographical data. In-depth discussions of the technical subtleties, methods, and wide range of applications of aerial triangulation in the GIS sector are provided in this extensive essay. The quality and precision of geographic data are critical in the wide field of Geographic Information Systems (GIS). To achieve this accuracy, aerial triangulation is essential. It is used extensively in mapping, surveying, and other geospatial applications. What is Aerial Triangulation in  Photogrammetry The measurement and computation of the ground coordinates of features acquired in aerial images are part of this complex procedure. This article delves into the specifics of aerial triangulation, examining its importance, foundational principles, and critical function in the GIS sector. The technique of combining overlapping aerial photos taken from various angles to determine a point’s geographic location on Earth’s surface is known as aerial triangulation. This method is based on the triangulation principles, which state that known places’ angles are measured to determine an unknown point’s position. When used in aerial imagery, this entails finding similar features throughout a series of photos and utilizing their apparent displacements to calculate precise ground coordinates. Essential Elements of Aerial Triangulation Points of control: Establishing ground control points (GCPs), which are carefully measured locations on Earth’s surface with known coordinates, is the first step in aerial triangulation. These ground control points (GCPs) act as connecting threads between the many aerial photos. The triangulation procedure as a whole is directly affected by the accuracy of the GCPs. Bundle Block Modification: The bundle block adjustment is crucial to aerial triangulation. The intricate mathematical process entails modifying the orientation parameters of every image in the block concurrently, guaranteeing a consistent and precise three-dimensional reconstruction of the topography. The modification improves the overall correctness of the spatial data by reducing mistakes and optimizing the image fit. Epipolar Lines and Matching: The idea of epipolar lines—the lines that connect the two overlapping image planes—is utilized in aerial triangulation. To ensure reliable feature matching across images, corresponding spots on these epipolar lines are identified automatically using algorithms. Matching is an essential step in obtaining accurate measurements and triangulating ground coordinates. Orientation both interior and exterior: There are internal and external orientation characteristics for every aerial image. The imaging platform’s position and attitude are included in the exterior orientation parameters, whereas the focal length, primary point coordinates, and lens distortion characteristics are included in the internal orientation parameters. For aerial triangulation to be successful, these characteristics must be determined and calibrated accurately. Digital Elevation Models (DEMs): Aerial triangulation frequently incorporates DEMs, which are surface topographic representations of the Earth. With the help of DEMs, differences in terrain elevation can be adjusted for, leading to more precise ground point determination. In a variety of environments, the triangulation procedure is more reliable when DEMs are included. Uses for Aerial Triangulation Topographic Mapping: A detailed topographic map is created by the use of aerial triangulation. The precise determination of ground coordinates guarantees the right placement of features on the map, augmenting its dependability for a range of uses, including environmental monitoring, infrastructure development, and urban planning. Orthophoto Production: Geometrically corrected aerial pictures, or orthophotos, are frequently utilized in GIS applications. To produce orthophotos of superior quality, aerial triangulation is essential for correcting errors resulting from camera viewpoint and terrain relief. Applications for these corrected photos include cadastral mapping, disaster management, and land-use planning. 3D Reconstruction: Accurate 3D representations of the Earth’s surface can be made more easily with the use of aerial triangulation. Three-dimensional reconstruction of the terrain can be achieved by triangulating points in several photographs. This enables extensive landform analysis, volumetric calculations, and simulations for a range of applications, such as geological investigations and urban modeling. Change Recognition: The ability to accurately discern changes in the landscape over time is made possible by aerial triangulation’s accuracy. GIS experts can detect and evaluate changes in land use, vegetation cover, and infrastructure by properly aligning historical and contemporary aerial photos. This process offers insightful information for environmental monitoring and urban planning. Progress in Aerial Triangulation Automation and Machine Learning: There is a growing need for automation in the aerial triangulation process due to the volume of aerial photography data. To automate the process of identifying and matching corresponding points, machine learning techniques are being utilized. This streamlines the workflow and minimizes the manual labor involved in the conventional method. Integration of Sensors: Aerial triangulation is becoming more powerful thanks to advancements in sensor technology like LiDAR (Light Detection and Ranging) and high-resolution cameras. By combining LiDAR data with aerial photography, complicated topography-related challenges can be overcome and 3D reconstructions and terrain modeling become more precise. Real-Time Processing: The development of real-time aerial triangulation technologies is being driven by the need for real-time geospatial information. These technologies make it possible to interpret aerial photos quickly, which enables real-time modifications and the quick availability of precise spatial data for uses like monitoring and emergency response. Multi-Sensor Fusion: The combination of information from several sensors, including thermal and optical cameras, is becoming more and more advantageous for aerial triangulation. Geospatial datasets that are more extensive and detailed can be produced by integrating varied sensor information, which expands the variety of features and qualities that can be captured. Aerial triangulation is a crucial component of Geographic Information Systems, providing precise spatial data that is needed for a wide range of applications. The importance of topographic mapping and 3D reconstruction in the GIS sector cannot be emphasized. The combination of automation, machine learning, and multi-sensor fusion is changing the aerial triangulation landscape and pushing the envelope in terms of efficiency and precision as technology develops.

Digital Surface Models (DSM)

Digital Surface Models (DSM) are becoming an indispensable tool in the field of Geographic Information Systems (GIS), offering a three-dimensional view of spatial data analysis. The complexity of DSM is examined in this article, along with its relevance, relationship to other elevation models, and applications. Terms such as Height Model, Digital Elevation Model (DEM), Building Height, and the development of 3D building representation are given particular attention. what is digital surface model? A digital surface model (DSM) is a depiction of the surface of the Earth that includes both natural and artificial structures. A digital surface model (DSM) includes the heights of all surface objects, including vegetation, buildings, and other structures, in contrast to a digital elevation model (DEM), which only records the elevation of the bare ground. In essence, a DSM offers a thorough perspective of the surface of the Earth, including the land and all of the objects that are on it. The idea of a Height Model is central to DSM. A mathematical representation of a point’s elevation on the surface of the Earth is called a height model. By giving each point a distinct height value, it makes it possible to create three-dimensional models. Height Models expand on the idea of traditional DEMs by incorporating the heights of all surface features. Traditional DEMs only concentrate on the ground elevation. Comparing the Digital Surface Model (DSM) and Digital Elevation Model (DEM) In order to fully understand DSM, it is imperative to distinguish it from a Digital Elevation Model (DEM). DEMs don’t take into account any surface objects; instead, they depict the entire surface of the Earth. On the other hand, DSMs provide a more comprehensive picture by including all features on the surface of the Earth. Use in City Environments: Removing Building Heights The use of DSM in urban planning and analysis is noteworthy. Building height extraction from DSMs is now a useful method for studying urban environments. Building heights are accurate when the ground elevation is subtracted from the total elevation in the DSM. The following steps are involved in the process: *Data Acquisition: To produce an in-depth DSM, high-resolution satellite imagery or LiDAR (Light Detection and Ranging) data are obtained. *Pre-processing: To ensure a clear depiction of the surface, noise and artifacts are eliminated from the DSM data. *Accurate building heights are obtained through height extraction, which involves deducting the ground elevation from the total elevation at each point. *3D Building Representation: Urban areas are represented in three dimensions using the building heights that were extracted. Urban Planning Revolutionized by 3D Building Models An entirely new paradigm is introduced when DSMs are incorporated into urban planning. Realistic three-dimensional models are added to traditional two-dimensional maps to provide planners and decision-makers with a more comprehensive understanding of the urban environment. Better analysis, decision-making, and visualization are facilitated by this expanded viewpoint. The Viewpoint of the GIS Sector on DSM DSMs are being used more and more in the GIS sector for a variety of purposes. Let’s examine a few essential technical terms that are used frequently in GIS discussions and have a tight relationship to DSMs. LiDAR Technology: A Revolutionary Approach to DSM Generation A key factor in the creation of precise and high-resolution DSMs is LiDAR technology. LiDAR sensors shoot laser beams into the air and time how long it takes for the light to bounce back off a surface. DSMs and other extremely detailed elevation models are subsequently made using this data. Because of its accuracy and effectiveness, LiDAR is a vital tool in the GIS field for obtaining minute details of the Earth’s surface. Point Clouds: DSM’s Basic Substance Point clouds are dense groups of three-dimensional points that depict the Earth’s surface in DSMs. These points—obtained by means of technologies such as LiDAR—serve as the basis for the creation of DSMs. The production of accurate and detailed DSMs is facilitated by point clouds’ high density. Filling in the Blanks with Spatial Interpolation A method for estimating values at unobserved locations based on the values at observed locations is called spatial interpolation. Spatial interpolation is used in the context of DSMs to fill in the blanks and produce a continuous surface. This ensures a more seamless and thorough DSM, especially in areas where data points may be sparse. Orthophoto: Strengthening Eye Focus Orthophotos are aerial photographs that have been geometrically corrected to eliminate perspective and relief-related distortions. Orthophotos improve the representation’s accuracy and visual clarity when superimposed over DSMs. For a number of uses, such as environmental monitoring and land-use planning, the integration of imagery and elevation data is essential. Obstacles and Potential Futures Despite their many uses and demonstrated value, DSMs are not without problems. Accurately representing intricate urban environments with overlapping structures is a major challenge. Accurately determining the ground elevation can also be hampered by dense vegetation. Overcoming Difficulties Using Complex Algorithms: To solve these problems, sophisticated algorithms—such as those based on artificial intelligence and machine learning—are being used more and more. These algorithms can improve the accuracy of DSMs in difficult environments by analyzing complex datasets and spotting patterns. The combination of these technologies has a lot of potential to get over current obstacles and increase DSM capabilities. Towards the Future: Going Beyond Visualization: In the future, it is anticipated that DSMs will develop beyond visualization. Real-time data streams, like those from Internet of Things (IoT) devices, can be integrated to provide dynamic and current surface-level information. Applications in infrastructure management, environmental conservation, and disaster monitoring are made possible by this real-time dimension. To sum up, Digital Surface Models (DSMs) are now a mainstay in the GIS sector, providing a thorough representation of the Earth’s surface through the incorporation of both natural and artificial features. Urban planning has undergone a revolution thanks to the extraction of building heights from DSMs, which offers a 3D perspective that improves analysis and decision-making. The technical jargon used in DSMs—such as LiDAR, point clouds, spatial interpolation, and orthophotos—has a significant impact on how